Excel spreadsheets contain densely packed data—data that is useful, but difficult to interpret. Flowcharts can help illustrate the relationships between various data points, adding clarity to your spreadsheets. This guide will lay out all the steps to make a flowchart in Excel and in Lucidchart, a powerful visual workspace.
8 minute read
Want to create a flowchart of your own? Try Lucidchart. It's fast, easy, and totally free.
How to make a flowchart in Excel
Microsoft Excel has features that allow you to make a flowchart directly within your Excel spreadsheet, but it will require some preliminary formatting and manual adjustments to implement your shapes and text. While we recommend saving time by using Lucidchart (skip to the next section to learn how!), we’ve outlined the steps to build a flowchart from within Excel below
1. Format a grid
Adding a grid to Excel will make creating flowcharts and diagrams a little easier, but know that it’s not required, especially if you’re experienced in Excel. By formatting a grid, you’re changing the column width so that it’s the same size as the default row heights, which will, in turn, make added shapes more uniform and properly proportioned.
To change the width of your columns, click the "Select All" button to select all of the cells in your spreadsheet. Right-click on one of the highlighted columns and select “Column Width.” Enter a new width in the dialogue box and click “OK.”
Default column width and row height in Excel are determined by your font choice. If you are using Calibri size 11 font, change the column width to 2.14 to format a grid. For other font choices, you’ll need to check the row height before adjusting column width. To do this, right-click on a row and select “Row Height.” Do not change the height, simply note the measurement and, following the steps above, change the column width to match.

2. Enable snap to grid/shape alignment feature
Selecting “Snap to Grid” makes flowchart shapes resize and “snap” to the nearest grid line, keeping sizing consistent across shapes. If you choose “Snap to Shape,” your shapes snap to the edges of other nearby shapes within your flowchart.
To enable either feature, go to Page Layout > Align > Snap to Grid (or Snap to Shape).
3. Adjust page layout as needed
Before making your flowchart, quickly run through the formatting guidelines it must follow. If you plan to print your flowchart or transfer it to Microsoft Word, for example, it must fit within a single page—you’ll need to change your spreadsheet layout accordingly.
Some layout elements to consider are margins, page orientation, and size. All of these can be adjusted from the page layout tab.
Be cautious when changing the Theme on the Page Layout tab; it not only alters fonts and color themes but also modifies row height and column width, which in turn can change the number of shapes that fit on a page.
4. Add Shapes
There are two ways to add shapes to a flowchart in Excel: you can use SmartArt or Shapes within the insert tab. SmartArt graphics are premade groups of shapes with styling and logic built into them. Shapes are individual objects that can be added to a spreadsheet and edited as necessary. You can refer to our flowchart symbols and notations guide to better familiarize yourself with the most commonly used flowchart shapes.
Adding symbols via SmartArt in Excel
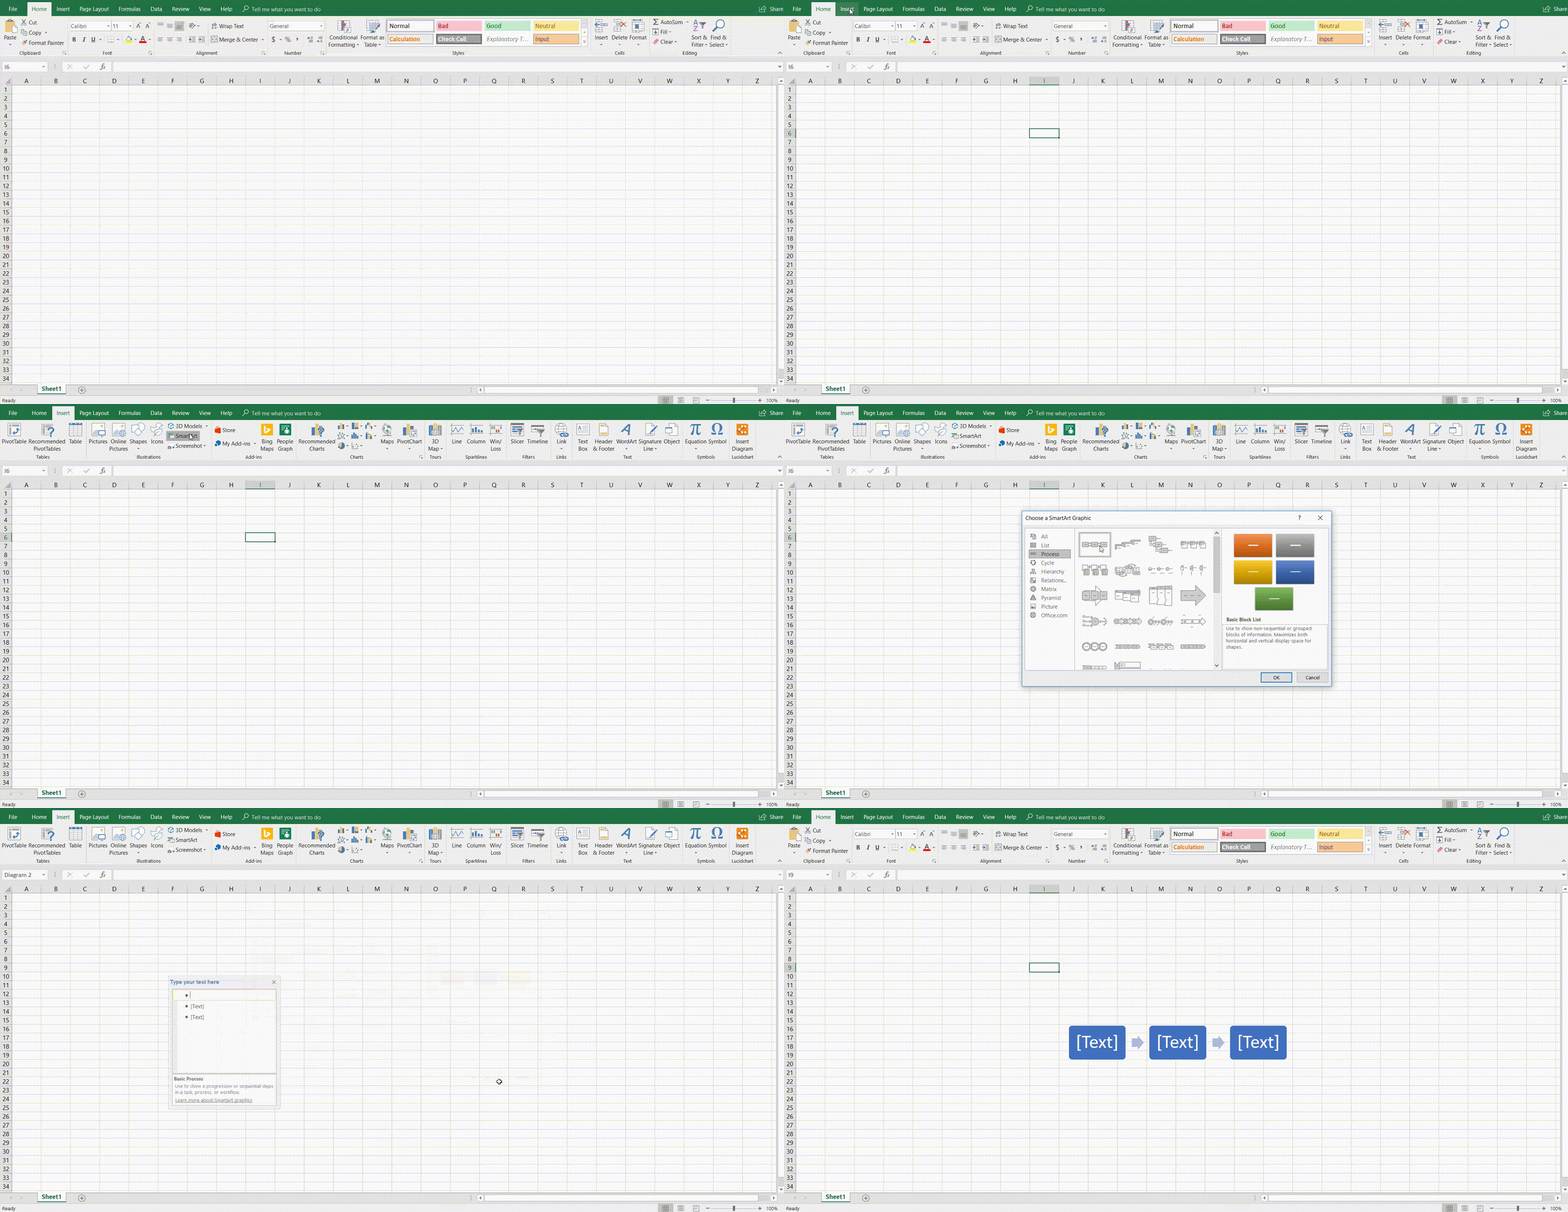
Go to the Insert tab and select SmartArt. A dialog will pop up and prompt you to pick a SmartArt graphic from the gallery. We recommend selecting graphics from within the “Process” category because they most closely resemble standard flowchart diagrams, but don’t feel limited to any single category. Choose any graphic that fits your diagramming needs.
Once you select the SmartArt graphic you want to insert, a preview of that flowchart graphic will appear in the right panel along with an explanation of its logic. Remember that not every option is classified as a flowchart shape.

To replace your diagram with a different SmartArt graphic, select it and press “Delete.” You can then click the SmartArt Graphics (Insert > SmartArt) and choose a different chart type. If you prefer to change the layout of a SmartArt graphic, select the shape(s) and select a new style from the Design tab within the Ribbon menu. At any time, the SmartArt chart layout can be edited without losing any text.
Continue to add flowchart shapes from the design tab and connect them with lines until your flowchart is ready. You may find that unlike the vast Lucidchart shape library and shape import features, some SmartArt Graphics don’t support unlimited shape addition. For those that do, select the shape nearest to where you want to add a new shape. You may need to select the entire chart, depending on which type you’ve inserted. Then choose an action, such as “Add a Shape,” from the design tab.

Adding symbols via shapes in Excel
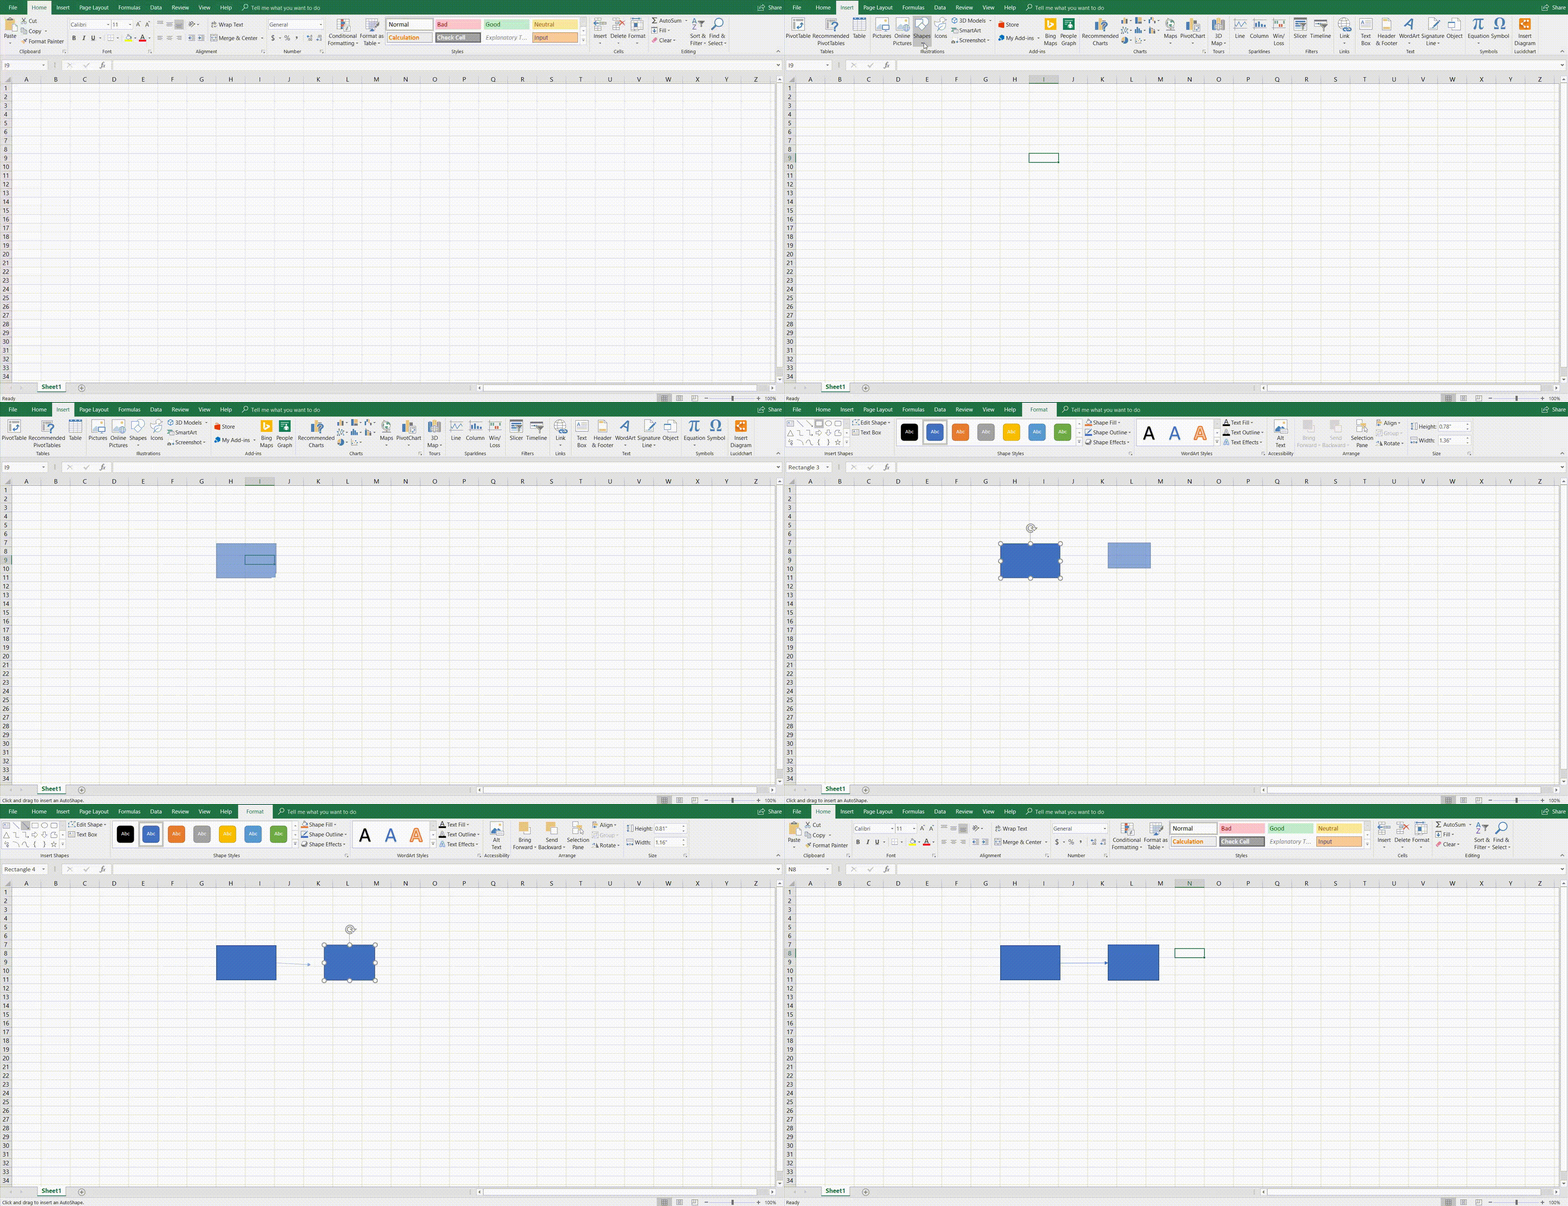
You can also build your flowchart in excel using the shapes tool. To access Excel’s shape library, go to the insert tab and click “Shapes.” A gallery will appear with a variety of basic shapes including lines, arrows, and geometric shapes. Scroll down to find the flowchart section.
Click the flowchart shape you want to add, then drag the shape to size on the Excel sheet. You can easily click on it to resize or move the shape anywhere on the document.
Continue to add shapes and connect them with lines until you’ve created your flowchart.

5. Add Text
Add text to your flowchart by clicking your placed flowchart symbol, and then begin typing. In SmartArt, the text boxes and font sizes will automatically resize based on how much text you add.
Edit your text by selecting font options from either the Ribbon home menu or the dialog box that appears next to the shapes.

6. Add Lines
To add lines, navigate to the insert tab, select "Shapes," then click the desired line style to connect shapes with lines. Click and drag on the spreadsheet to draw the line.
7. Format the Flowchart
Once you have your flowchart shapes, text, and lines in your Excel sheet, the ribbon at the top offers additional customization options for colors, styles, and formats. Play around with your lines and shapes within the Insert tab and increase the line thickness, font styles, colors, and transparency.
Want to create a flowchart of your own? Try Lucidchart. It's fast, easy, and totally free.
Create a flowchartHow to make a flowchart in Lucidchart
Creating flowcharts in Excel can be a slow, frustrating process, and the process doesn’t offer much flexibility. Lucidchart helps you create fully customized flowcharts in half the time. To learn how to make a flowchart with Lucidchart, follow the steps below.
1. Sign up for a free Lucidchart account
Before getting started on your flowchart, you’ll need to register for a Lucidchart account—don’t worry, it’s quick and free! Just click “Sign Up,” enter your name and email address, choose a password, and you’re all set.
2. Create a new document and add basic shapes
When you create a new document in Lucidchart, there are two options: starting from scratch or from a template. Templates are a great option if you’re new to flowcharting or looking to save time, but don’t be daunted by starting from scratch—with Lucidchart, both options are very straightforward.
Starting from a template
To open Lucidchart’s template library, click the down arrow next to “+Document.” Select a diagram category on the left—in this case, choose “Flowchart”—or use the search bar to find a specific template type.
Double-click on a thumbnail image to use that template or single-click to read more about it. If you decide not to use any template, simply select “Blank Diagram.”
Starting from scratch
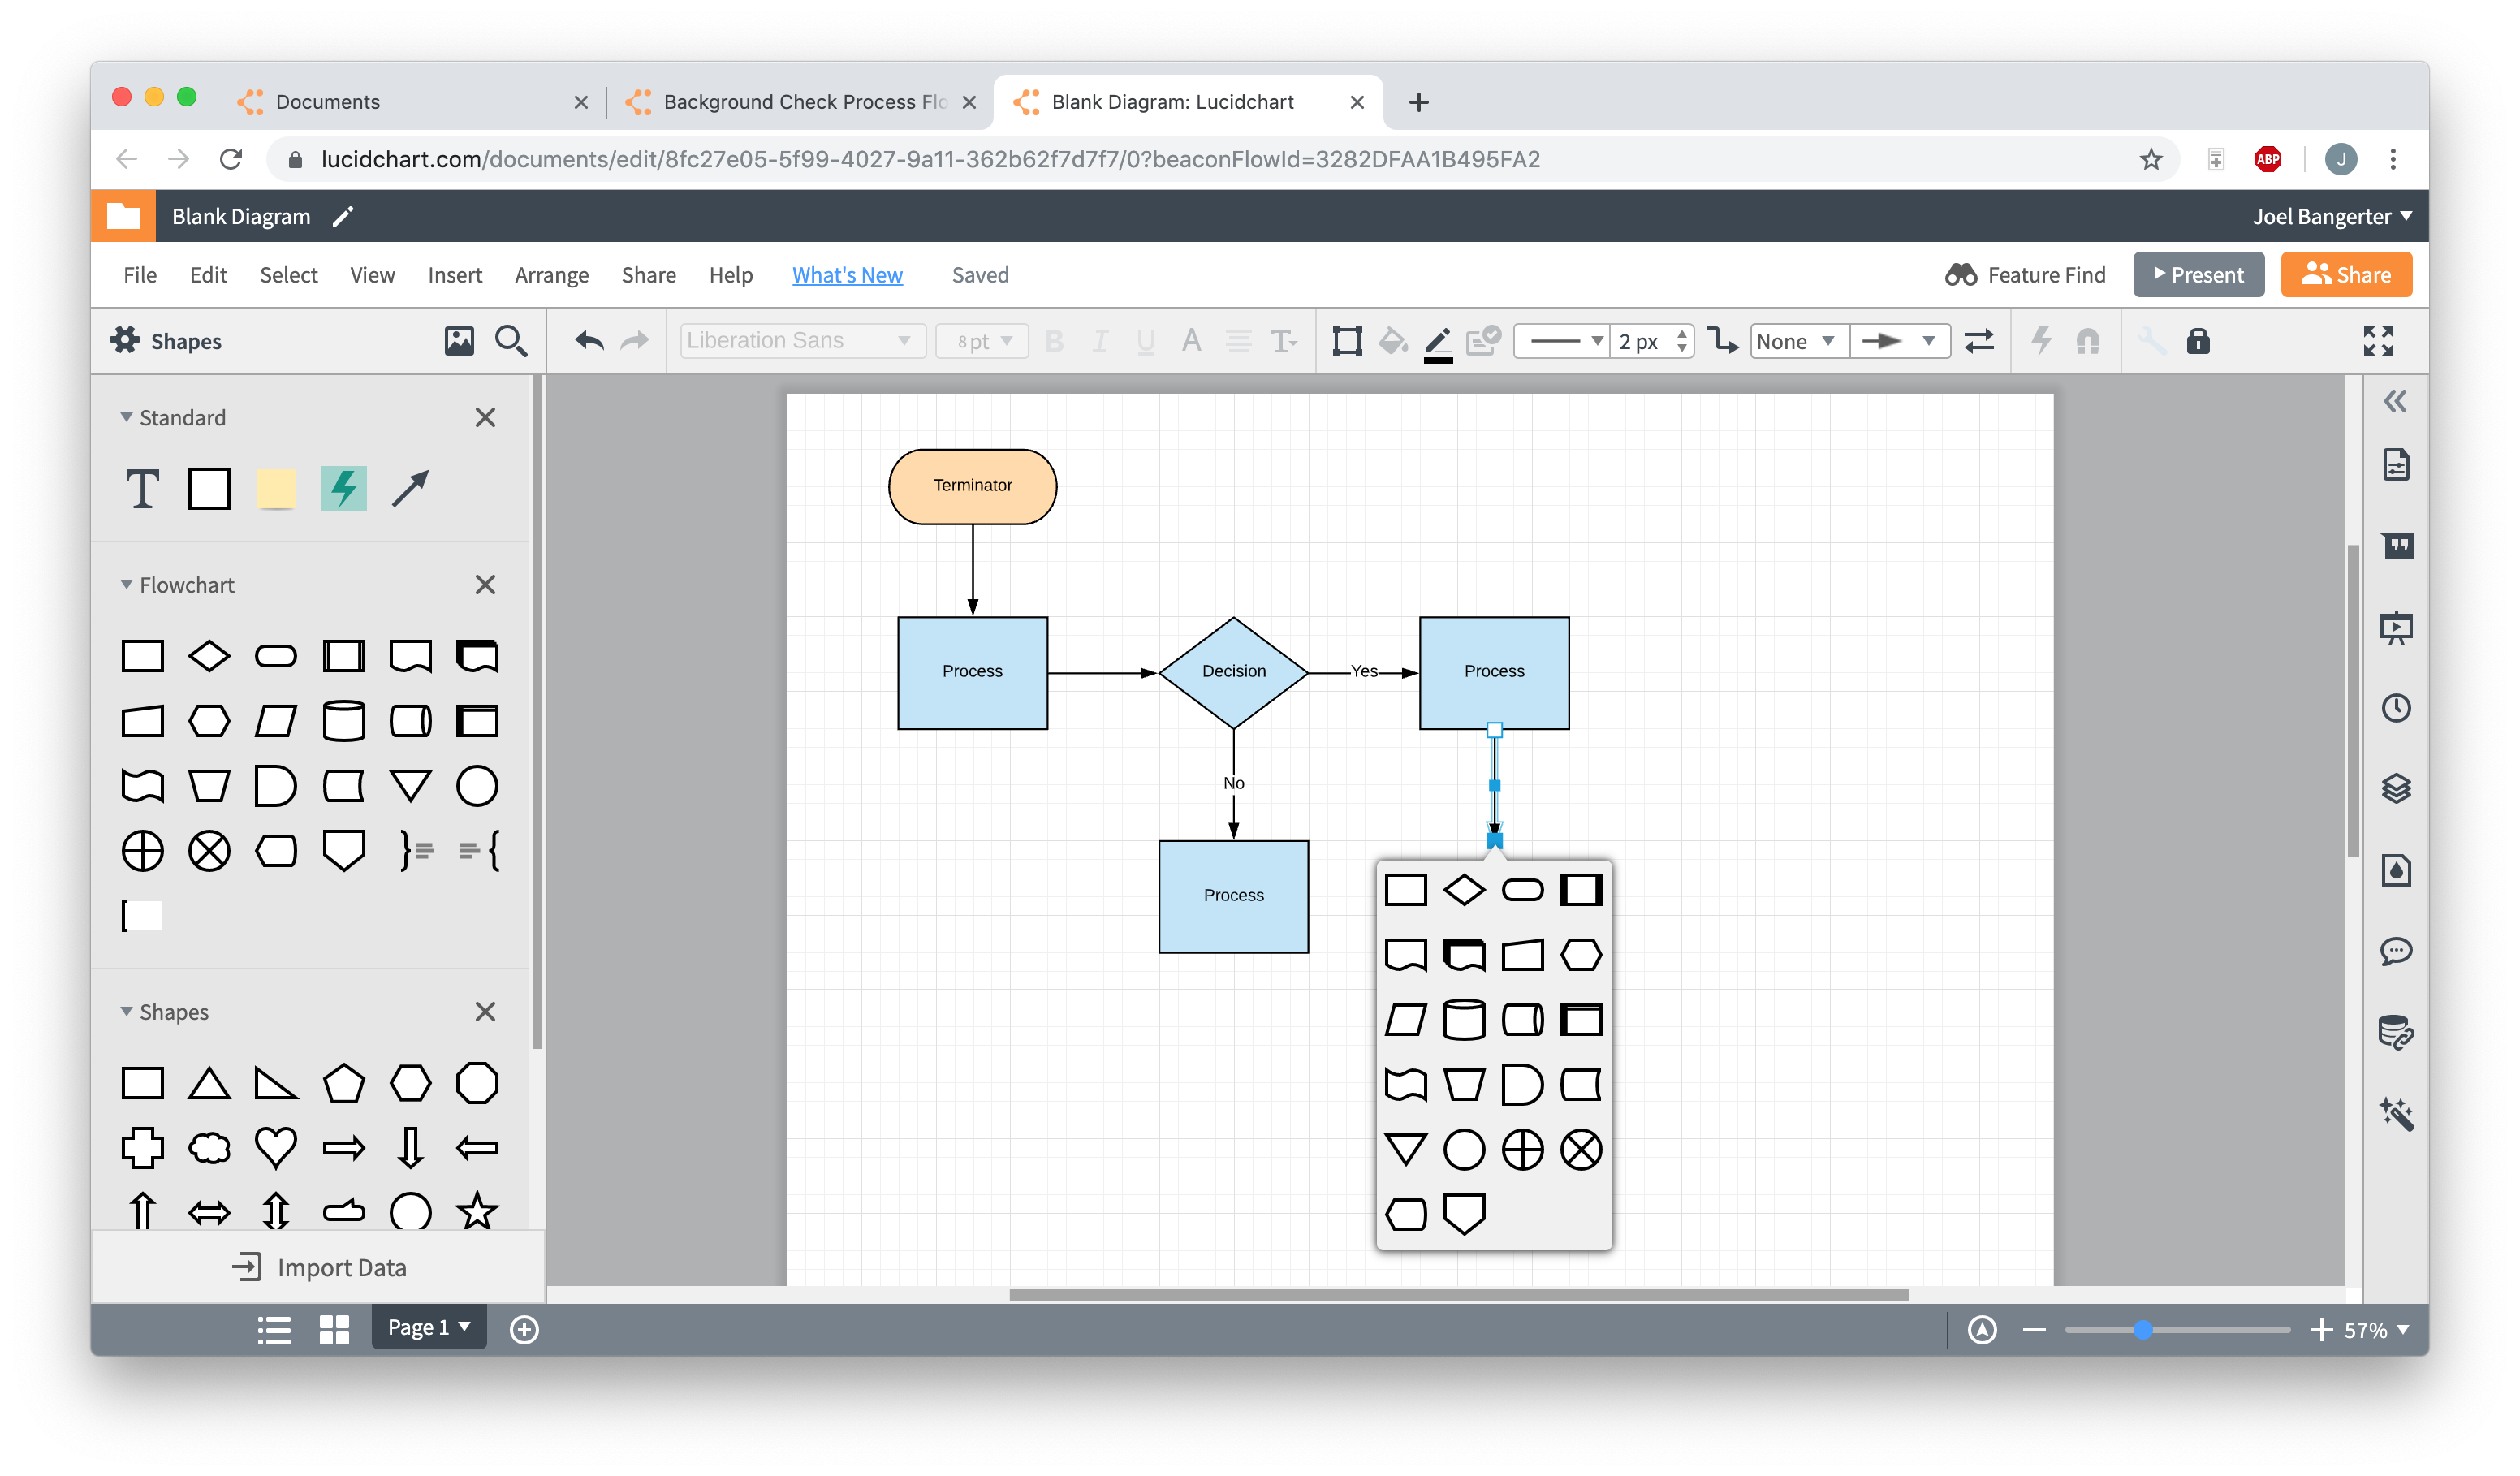
To create a blank diagram, click “+Document.” By default, the flowchart shape library is pinned to the shape menu on the left-hand side of the editor. All of the shapes you’ll need for a flowchart can be found there—just drag and drop them onto your canvas.
Click and drag between shapes to add connecting arrows. You can also add shapes by clicking on an existing shape and dragging your cursor as if to connect it to another shape. Instead of connecting the arrow to another shape, just release your click in empty space. A small pop-up shapes menu will appear—clicking a flowchart shape from that menu will insert it at the end of the arrow.
3. Add or edit text
Once you have all of your shapes and lines added to your flowchart, it’s time to label them. Double-click a shape or line to add text or to edit existing text. Edit font size, style, etc. using the toolbar at the top of the editor.
4. Format and style your flowchart
At this point, your flowchart is practically complete—it functions exactly as it should, you just need to make it look nice. If you started from a template, your diagram already has colors and fonts applied. Lucidchart templates are completely customizable, so you can change any of these using the toolbar at the top of the editor.
If you started from scratch, use the toolbar to add colors, change fonts, adjust line weight, and much more. Because nearly every aspect of each shape and line can be changed, you can make your flowchart look exactly how you want it to. (Tip: Click and drag your cursor to select multiple shapes—they can then be edited simultaneously!)
To set a document theme (diagram-wide styling and formatting guidelines), click the droplet icon at the top of the editor. Simply click a theme to apply it to your entire diagram.
How to insert your Lucidchart diagram into Excel
Rather than deal with the extensive formatting, additional steps, and overall hassle of building a flowchart in Excel, follow these steps to bring your Lucidchart diagrams directly into Excel. It’s quick, easy, and free!
1. Download the MS Office add-in
To download the Lucidchart add-in, open Excel and go to Insert > My Add-ins > Store. Lucidchart should show up as a recommended add-in, but you can also use the search bar to find it. Once you’ve found it, click “Add.”
2. Select a diagram to add to your spreadsheet
In Excel, go to Insert > My Add-ins > Lucidchart. This opens the Lucidchart add-in pane on the right-hand side of your document. Select the diagram that you’d like to add, and click “Insert.”
If you make any changes to your Lucidchart diagram, simply re-insert it in Excel to apply those changes.


