Object diagrams demonstrate various parts of a complex system. This guide will teach you how to create your own object diagram in Lucidchart. With a user-friendly interface and extensive UML shapes and connectors, Lucidchart simplifies the creation of UML object diagrams.
3 minute read
Do you want to create your own UML diagram? Try Lucidchart. It's fast, easy, and totally free.
How to create an object diagram in UML
Object diagrams are specific instances of class diagrams that present a high-level overview of your system. Use these diagrams to drill down into a system or software and analyze each individual part and its attributes. Check out this guide for a more in-depth review of object diagrams.
Get started with Lucidchart
To create your very own UML object diagram, we recommend that you sign up for a free Lucidchart account. Lucidchart was created specifically for creating technical diagrams like these, and its simple drag-and-drop interface will help you finish your diagram in no time.
Once you have signed up for Lucidchart, select Create New Document > Blank UML. The UML shape libraries will appear on the left side of the canvas.
Do you want to create your own UML diagram? Try Lucidchart. It's fast, easy, and totally free.
Create a UML DiagramAdd shapes
Object diagrams are one of the simplest types of UML diagrams. Visually, they resemble a simplified class diagram. Objects are represented by simple rectangle shapes. You can include subdivisions in the rectangle to separate the title from its attributes. These shapes are then connected by lines that show the relationship between objects.
For a basic rectangle, drag out the simple class shape from the UML Class Diagram section.

Add lines
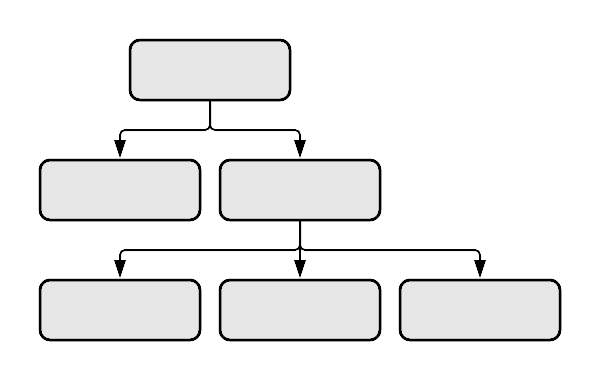
One of the advantages of using Lucidchart to build object diagrams is that you have a high degree of control over line styles. For this diagram, we’ll use a solid diamond for the origin of the line, a solid black line, and an arrow on the end of the line. These styles will help the viewer see how all three accounts depend on the bank.
Create a line by dragging your mouse from the red circle that appears when you hover over the first object. A dialog will appear: Choose a rounded rectangle for the next shape. To add text in a shape in Lucidchart, simply double-click inside it.

Add color
Object diagrams are designed to give a bird’s-eye view of a software system. To improve the readability of your diagram, add color to easily differentiate between objects.
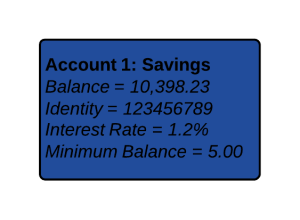
Think about the overarching category of each object (rectangle) in your diagram. For example, in a banking object diagram, we’re specifying accounts. We’ll use “Account 1: Savings” as the class title for this object.
Add attributes
Attributes do not need to be obscure. In this object, we’ve added the major identifiers of this particular savings account (balance, identity, interest rate, and minimum balance) as a list of class attributes after the title. In Lucidchart, simply press Enter to start a new line. It’s easy to see how the particular attributes would change for a different object (like a checking account, which would have a different interest rate) or the same object in a different scenario (savings account A will have a different ID with the bank than savings account B).
Format object diagram
Lucidchart allows you to style your flowchart with customizable colors, fonts, and image import. Let’s keep this diagram simple by making the class title bold. After you select a shape, you can change the fill background from the top toolbar. Varying the color of objects makes it easy to distinguish accounts at a glance.

Add icons
To further customize your object diagram, use Lucidchart’s icon finder feature to search for an applicable icon on the left side of your screen.
Add an icon to your object diagram to improve your ability to understand the diagram at a quick glance.

Publish, implement, and share
After you finish your document, sharing it with others is a likely next step. You can add diagrams to any document in Microsoft Office, G Suite, Confluence, or other popular application quickly and easily, thanks to Lucidchart integrations. To download your object diagram, simply click File > Download As and the desired file type.
If you wish to collaborate with co-workers, however, you'll want to share your document. To share your document, click the orange "Share" button in the top-right corner of the editor. From this menu, you will be able to easily share your object diagram with both Lucidchart users and non-users or post the diagram to social media.
