A timing diagram is a specific behavioral modeling diagram that focuses on timing constraints. If you need to know how objects interact with each other during a certain period of time, create a timing diagram with our UML diagramming software and refer to this guide if you need additional insight along the way.
2 minute read
Do you want to create your own UML diagram? Try Lucidchart. It's fast, easy, and totally free.
What is a timing diagram?
Think of a timing diagram as an inverted sequence diagram. In a timing diagram, time passes on the x-axis from left to right, with different components of the system that interact with each other on the y-axis. Timing diagrams show how long each step of a process takes. Use them to identify which steps of a process require too much time and to find areas for improvement.
Lucidchart makes the process of creating your timing diagram incredibly easy with its UML software. In fact, you can create any UML diagram in Lucidchart, including sequence diagrams, activity diagrams, and class diagrams. Sign up for a free Lucidchart account today to begin diagramming!
Do you want to create your own UML diagram? Try Lucidchart. It's fast, easy, and totally free.
Create a UML DiagramTiming diagram components
With timing diagrams, you can easily diagram a process and identify the major steps it takes to complete the process. First, identify the major participants in the process. If you were to create a timing diagram for a factory, you would identify departments such as design, sourcing, manufacturing, QA, shipping, etc.
Then, follow the process closely, charting the time each product spends with each department. The end result should help factory administration to recognize which departments are understaffed, inefficient, or overloaded.
Timing diagram examples
Boat manufacturing timing diagram example
In this simplified example of a boat manufacturing plant, a timing diagram shows that too much time is spent on the upholstery stages of production. As a result, factory administrators may assign more employees to the upholstery stations or seek out ways to increase efficiency. If administrators can effectively use a timing diagram to increase efficiency, the process can be significantly improved, decreasing both time and money spent on the process.

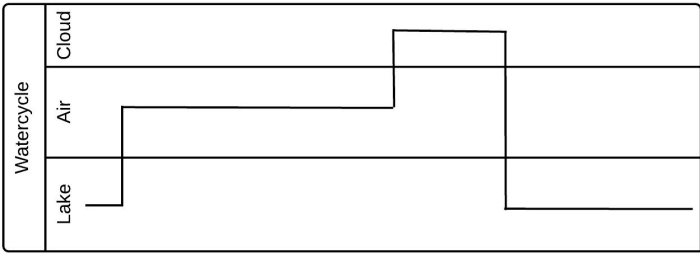
Water cycle timing diagram example
This timing diagram example shows a simplified version of the water cycle. Since the timing diagram focuses on how long each step takes, not on the system itself, you could think of this as a diagram of the different phases that a water droplet cycles through. If this were a manufacturing process, viewers could easily identify areas for improvement. Timing diagrams are powerful tools for making a system as efficient as possible.

