
Types of UML diagrams
Reading time: about 7 min
If you’ve had any sort of formal code training, you were probably introduced to UML diagrams in school. But how much have you used them after that point? Because UML diagrams take some time to build and become out of date fairly quickly in an Agile environment, many software developers have forgotten about them.
However, visual documentation can help engineers in the form of UML diagrams in a number of ways, from onboarding new employees to giving stakeholders a quick overview of the system so developers don’t waste time in meetings.
While Lucidchart is an essential UML diagram tool, this article will introduce (or give you a refresher) on the different UML diagram types, as well as provide use case template examples that you can use in Lucidchart.
What are UML diagrams?
UML, which stands for Unified Modeling Language, is a way to visually represent the architecture, design, and implementation of complex software systems. When you’re writing code, there are thousands of lines in an application, and it’s difficult to keep track of the relationships and hierarchies within a software system. UML diagrams divide that software system into components and subcomponents.
Why should you use UML diagrams?
UML is a standardized modeling language that can be used across different programming languages and development processes, so the majority of software developers will understand it and be able to apply it to their work.
Though many engineers dread diagrams, they’re useful in an Agile development environment: they keep development productive and focused. Instead of thinking them as just a “nice to have,” treat your UML diagrams as core aspects of documentation. UML diagrams can help engineering teams:
- Bring new team members or developers switching teams up to speed quickly.
- Navigate source code.
- Plan out new features before any programming takes place.
- Communicate with technical and non-technical audiences more easily.
However, diagrams that don’t evolve with a project are useless, so it’s necessary to have constantly evolving diagrams. Lucidchart, a cloud-based diagramming solution, makes this process easier. Lucidchart can generate UML sequence diagrams from text markup, which makes diagramming automatic and elastic.
What are the types of UML diagrams?
To the uninitiated, it may seem as though there is an infinite number of UML diagrams, but in actuality, UML standards identify 13 types of diagrams that are divided into two groups, defined below.
Structural UML diagrams
Structural UML diagrams, as the name would suggest, show how the system is structured, including the classes, objects, packages, components, etc. in the system and the relationships between those elements.
Class diagram
Because a lot of software is based on object-oriented programming, where developers define types of functions that can be used, class diagrams are the most commonly used type of UML diagram. Class diagrams show the static structure of a system, including classes, their attributes and behaviors, and the relationships between each class.
A class is represented by a rectangle that contains three compartments stacked vertically—the top compartment contains the class’s name and is mandatory, but the bottom two compartments give details about the class attributes and class operations or behaviors.
Component diagram
A component diagram is essentially a more specialized version of the class diagram—the same notation rules apply for both. A component diagram breaks a complex system down into smaller components and visualizes the relationship between those components.
Deployment diagram
Deployment diagrams show how software is deployed on hardware components in a system. These diagrams are most useful for systems engineers, and they usually show performance, scalability, maintainability, and portability. When hardware components are displayed in relation to each other, it’s easier to keep track of your entire hardware mesh and make sure that all elements are accounted for in a deployment.

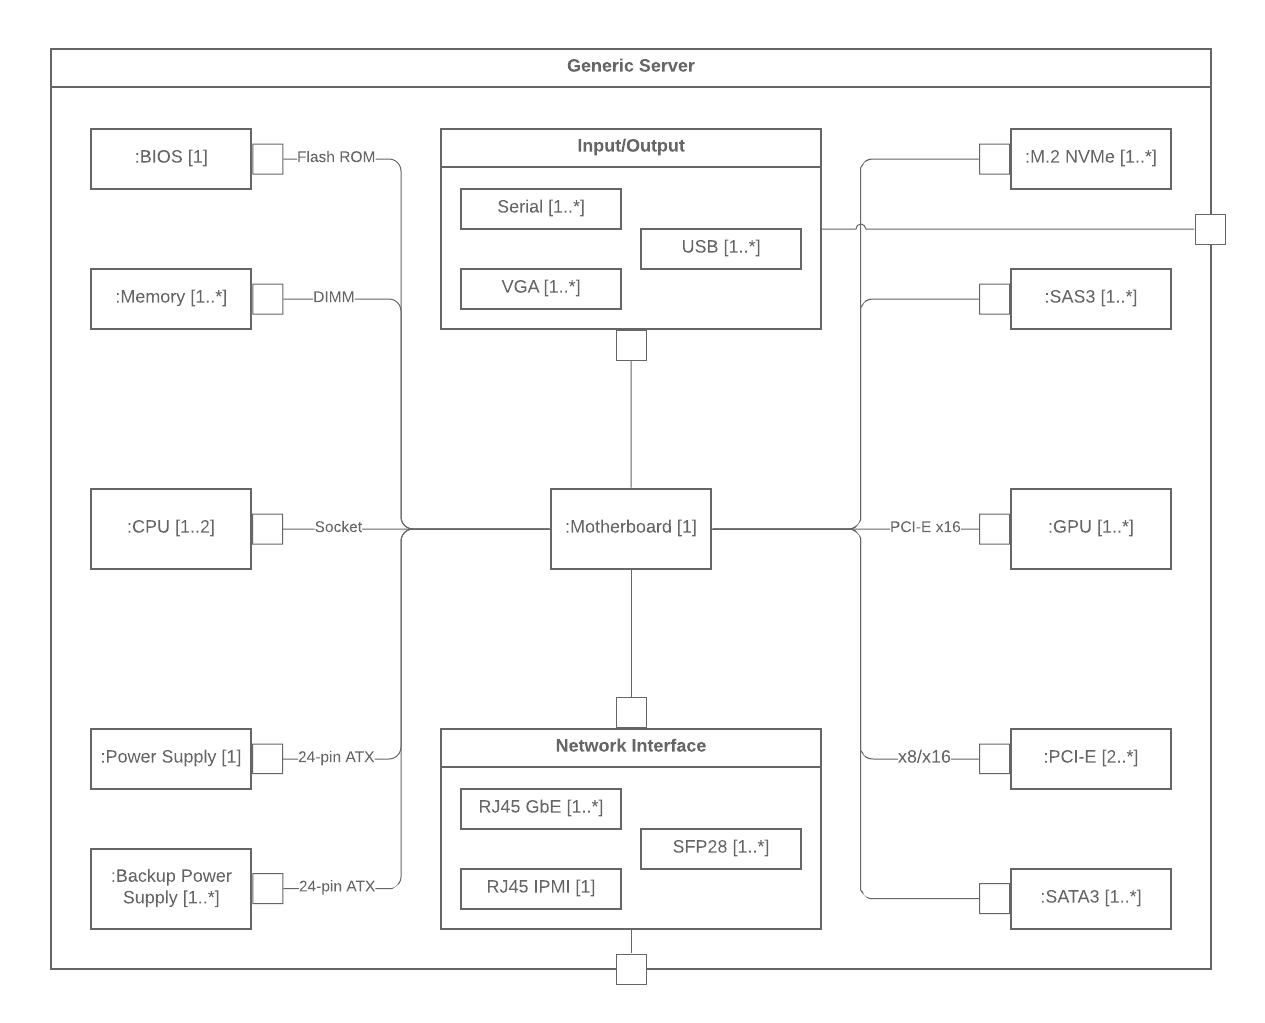
Composite structure diagram
These types of diagrams are essentially the blueprints for the internal structure of a classifier. They can also be used to show the behavior of a collaboration or the classifier interactions with their environment through ports. They can easily depict the internal components of any hardware to more thoroughly understand the inner workings.
Object diagram
Object diagrams show examples of data structures at a specific time. You could use a class diagram to show a structure and then use object diagrams as test cases to verify the completeness of your class diagram. Or you could create an object diagram to discover information about model elements and their links.
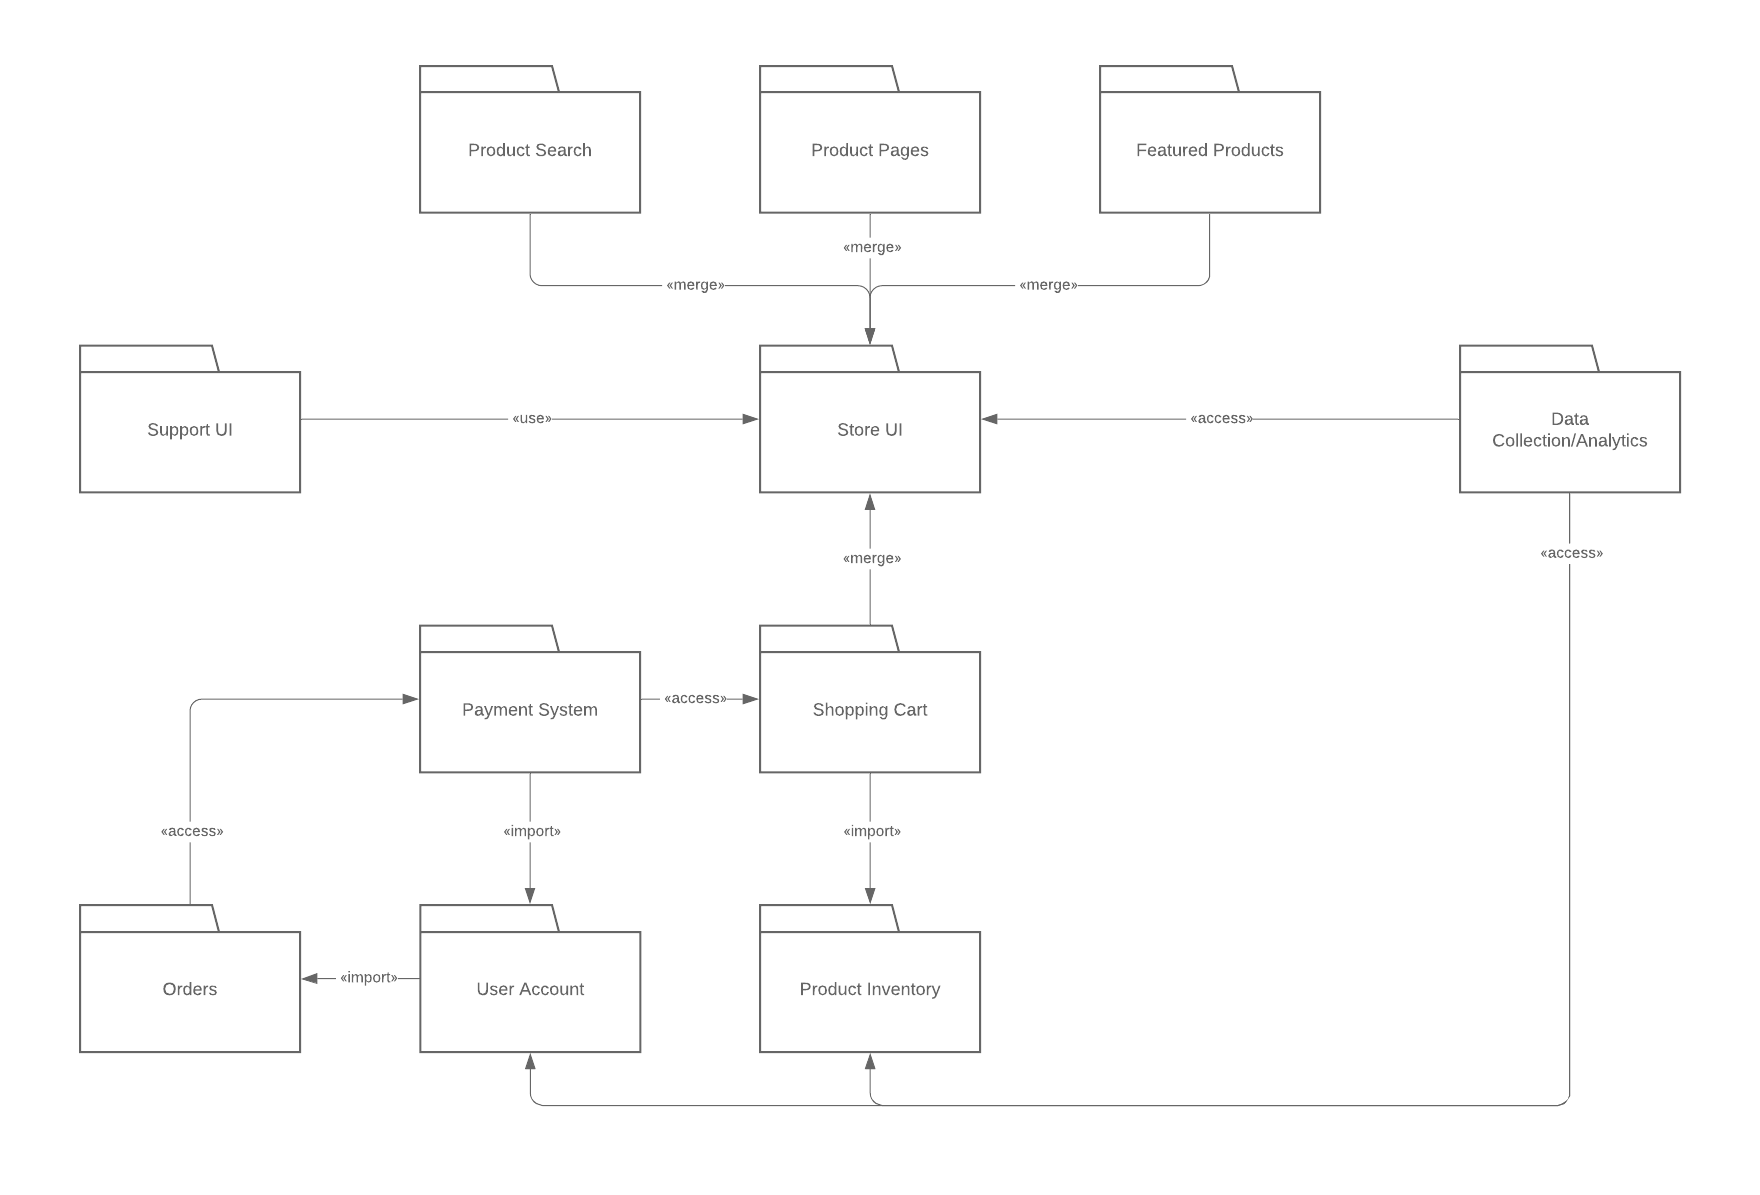
Package diagram
Package diagrams are used to show dependencies between different packages in a system. A package, depicted as a file folder, organizes model elements, such as use cases or classes, into groups.
Profile diagram
Recently added to UML 2.0, profile diagrams are unique and rarely used in any specification. A profile diagram is best understood as an extensibility mechanism for customizing UML models for specific domains and platforms.
Behavioral UML diagrams
These UML diagrams visualize how the system behaves and interacts with itself and with users, other systems, and other entities.
Timing diagram
Often described as an inverted sequence diagram, a timing diagram shows how objects interact with each other in a given timeframe. Use these diagrams to see how long each step of a process takes and find areas for improvement.
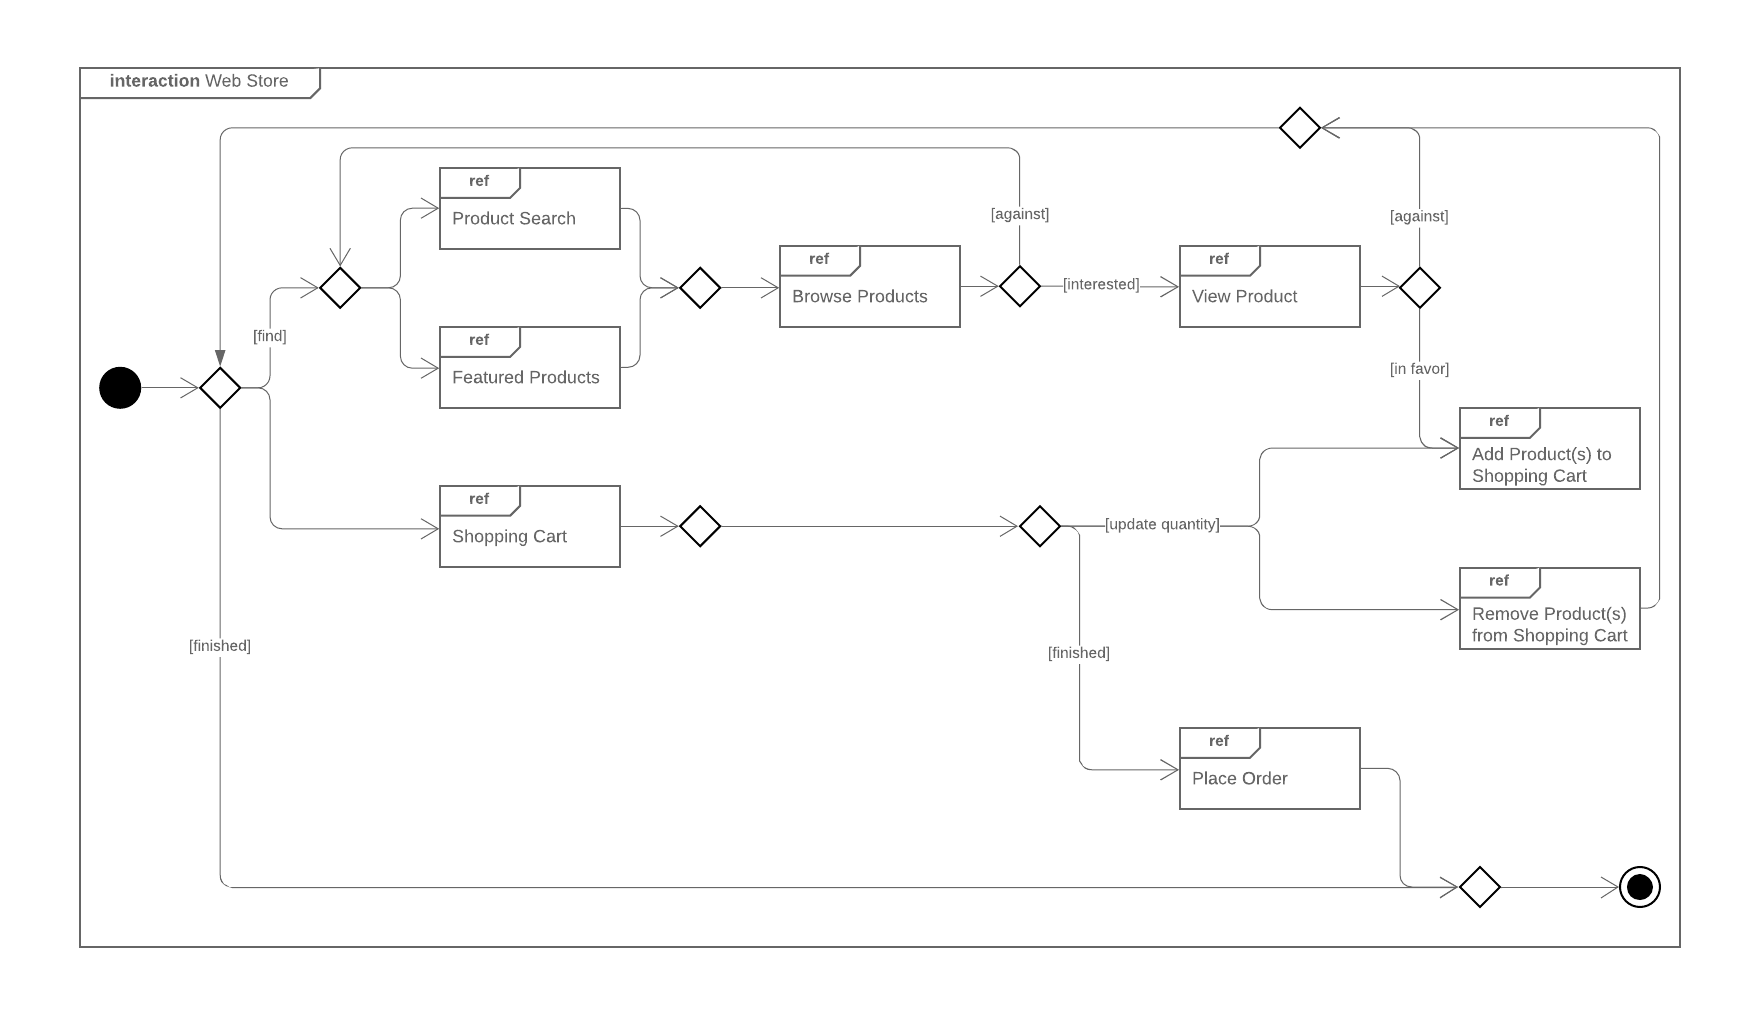
Interaction overview diagram
This diagram overviews the flow of control between interacting nodes. They include initial nodes, flow final nodes, activity final nodes, decision nodes, merge nodes, fork nodes, and join nodes.
Communication diagram
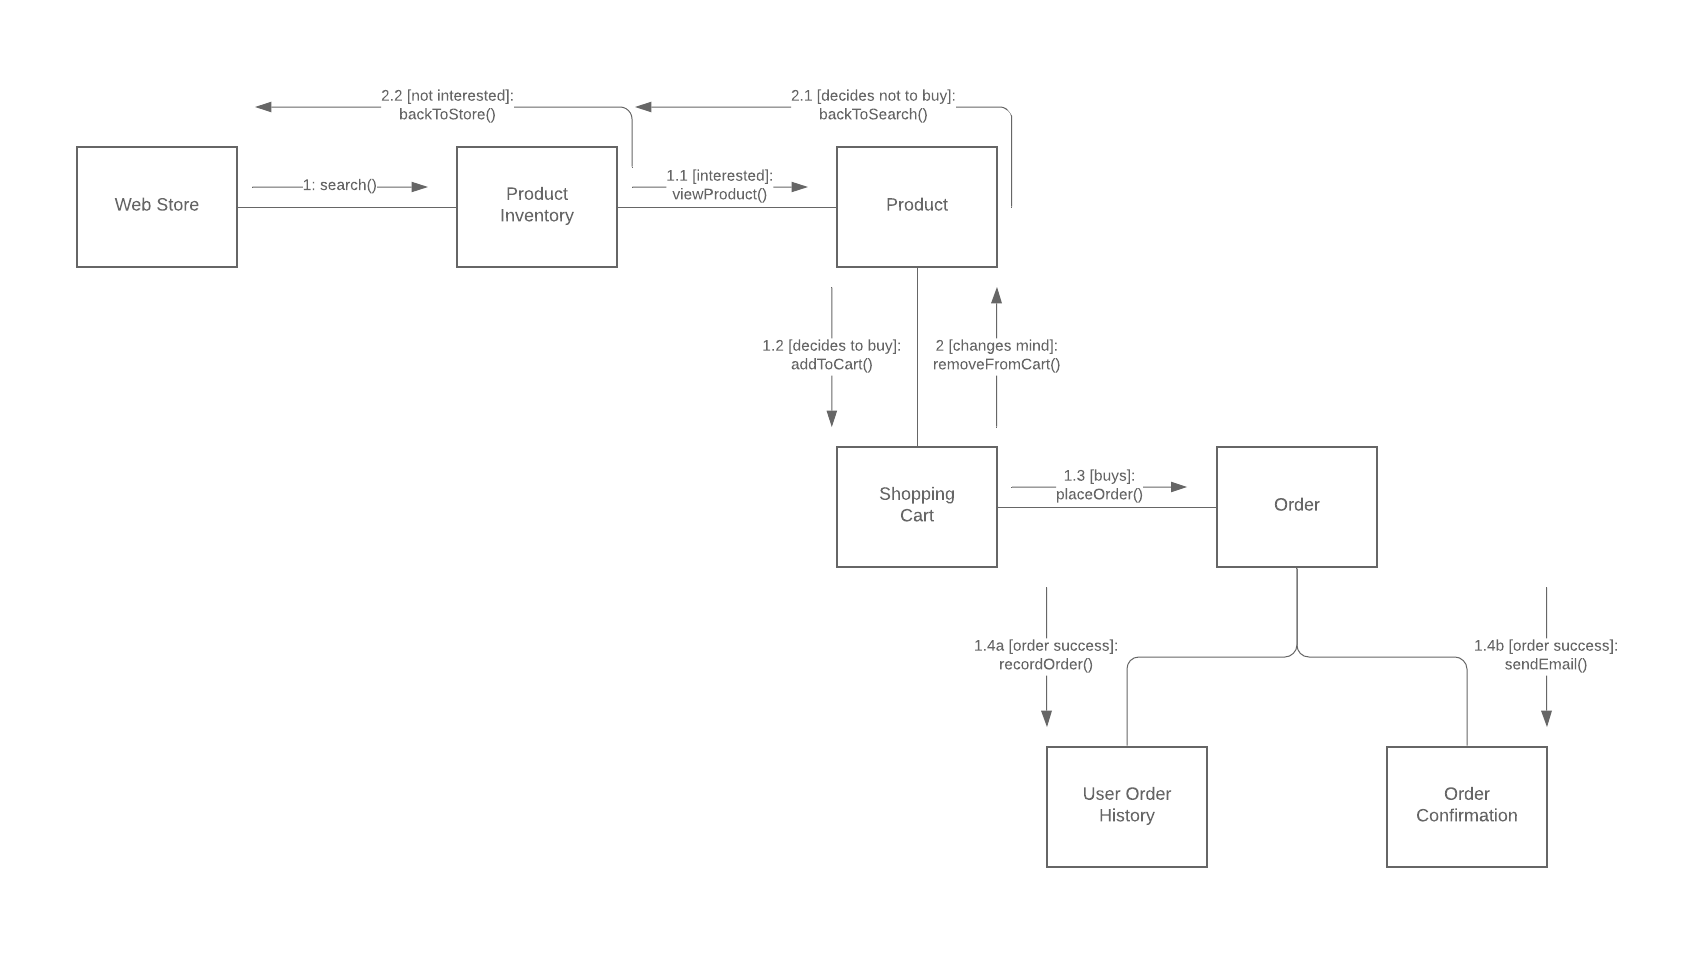
Communication diagrams, which used to be called collaboration diagrams, show how objects relate to each other. They model the way objects associate and connect through messages within an architectural design of a system. They can also show alternative scenarios within use cases or operations that require the collaboration of different objects and interactions.
State diagram
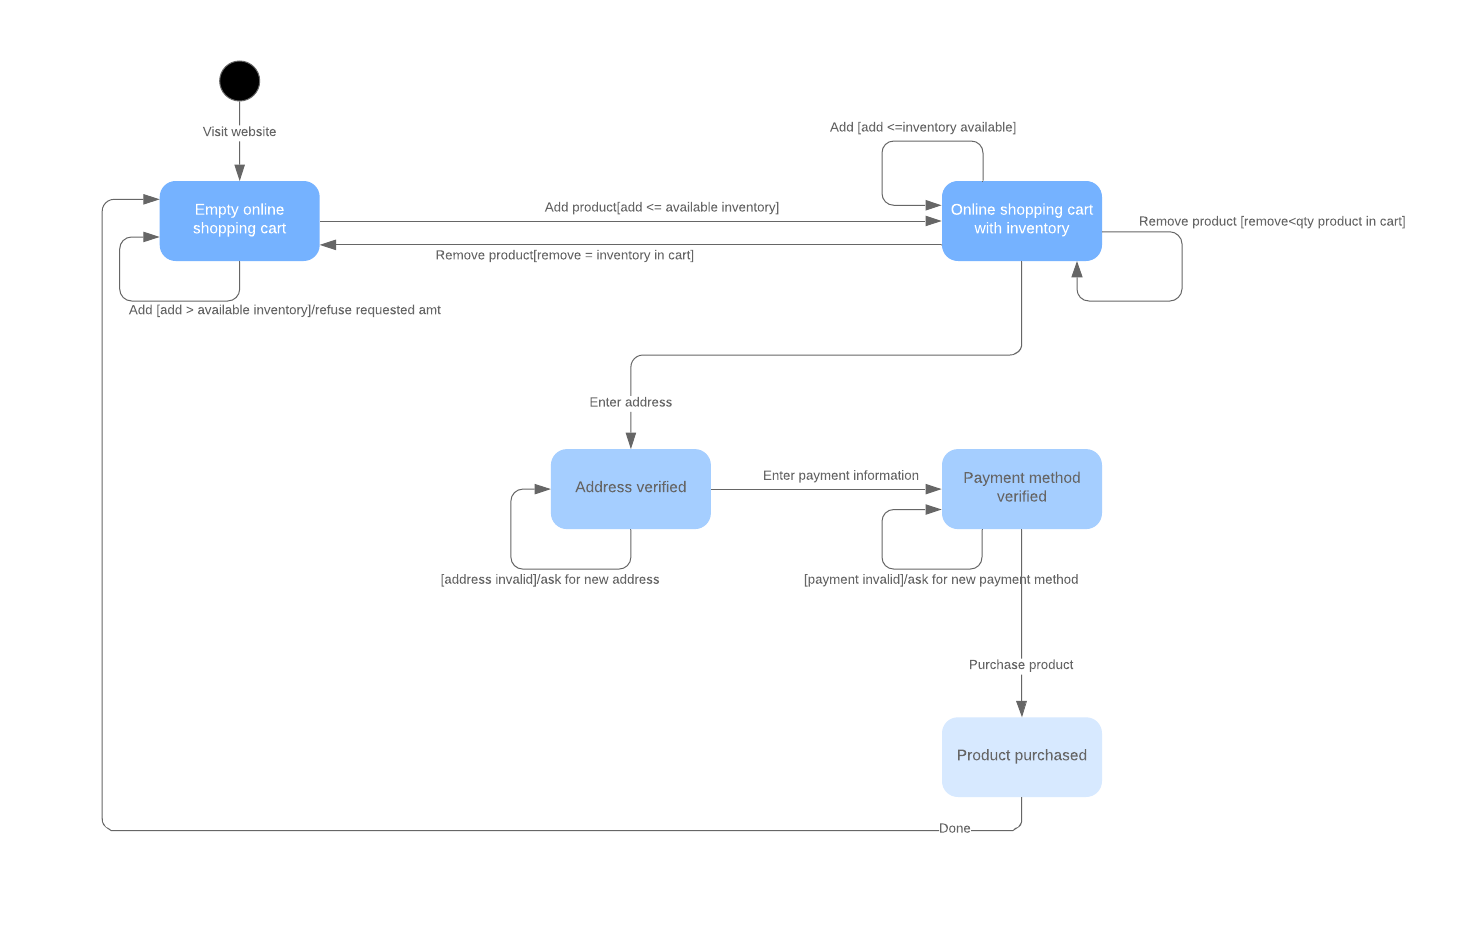
State diagrams, simply put, depict states and transitions. A state refers to the different combinations of information that an object can hold, and this UML diagram can visualize all possible states and the way the object transitions from one state to the next.
Use case diagram
Use case diagrams model how users, displayed as stick figures called “actors,” interact with the system. This type of UML diagram should be a high-level overview of the relationships between actors and systems, so it can be a great tool for explaining your system to a non-technical audience.
Sequence diagram
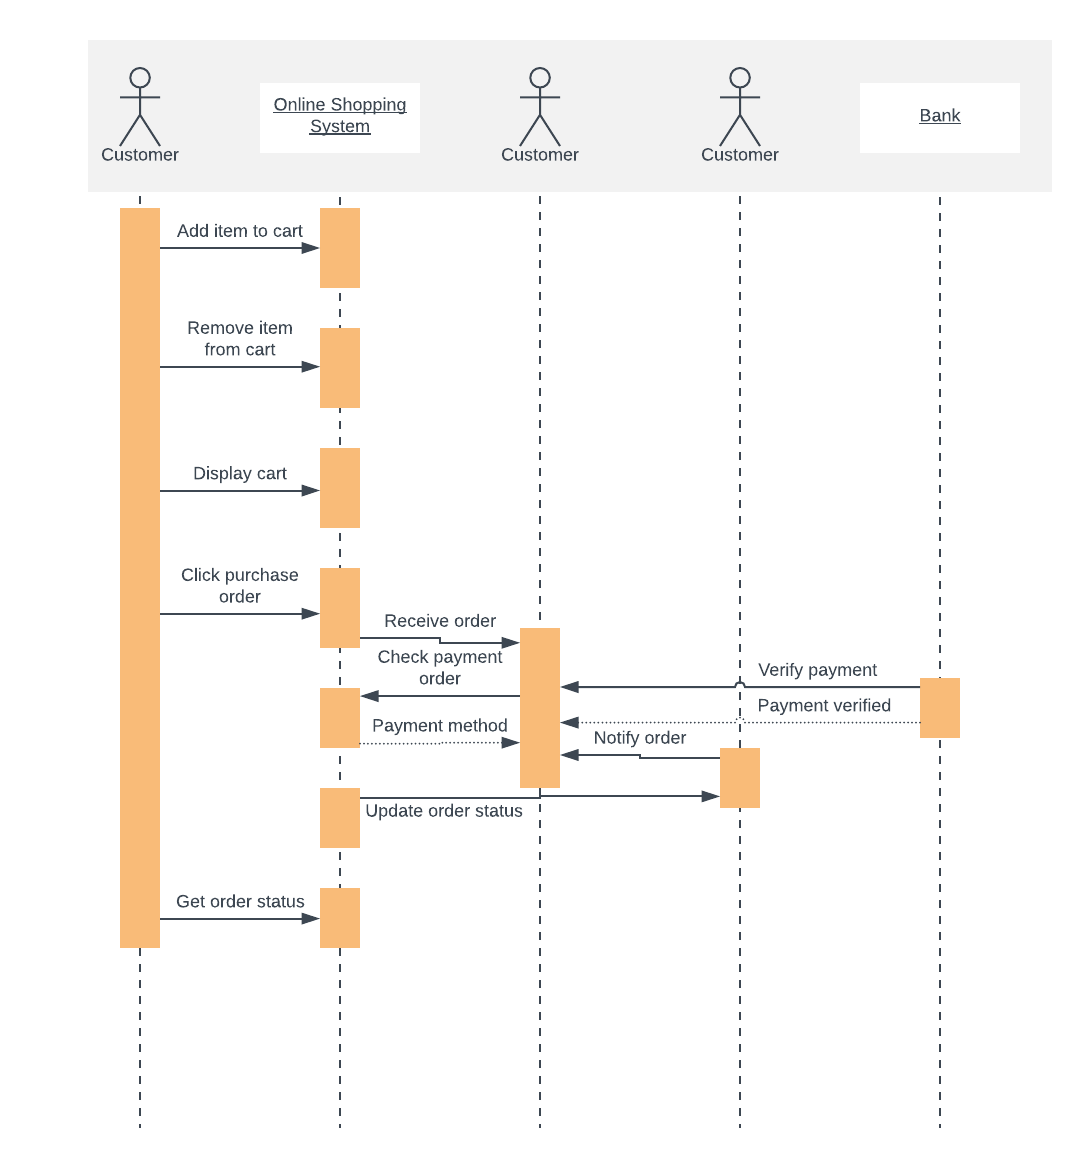
A sequence diagram, sometimes referred to as an event diagram or an event scenario, shows the order in which objects interact. This way, you can visually represent simple runtime scenarios.
Activity diagram
Activity diagrams visualize the steps performed in a use case—the activities can be sequential, branched, or concurrent. This type of UML diagram is used to show the dynamic behavior of a system, but it can also be useful in business process modeling.
If you’d like additional inspiration, check out our full post of UML diagram template examples.
These UML diagram templates should give you a starting point and drive home our central point: that UML diagrams aren’t just an optional part of the development process, but a vital part of documentation that should be integrated into any Agile development team.
How to make a UML diagram
UML diagrams follow a specific set of rules and shapes, and you could spend a significant amount of time learning how to correctly build each type. Luckily, we’ve made it easy for you with easy tutorials, starting with class diagrams, that walk you through the process step by step.
Become a UML evangelist
Sometimes it’s not enough for you to be on board the UML diagramming train: After all, as a software developer, you’re usually working with teams, and it’s important to get everyone else along for the ride.
If your team is reluctant to integrate UML diagrams into the development process, propose using them for just one project to start. Once your team sees what a boon UML diagrams are to documentation, they’ll be more willing to start making them a necessary step.
Plus, with Lucidchart, creating UML diagrams aren’t a chore: They’re an asset.

Get started with the UML templates and shape libraries in Lucidchart.
Sign up freeAbout Lucidchart
Lucidchart, a cloud-based intelligent diagramming application, is a core component of Lucid Software's Visual Collaboration Suite. This intuitive, cloud-based solution empowers teams to collaborate in real-time to build flowcharts, mockups, UML diagrams, customer journey maps, and more. Lucidchart propels teams forward to build the future faster. Lucid is proud to serve top businesses around the world, including customers such as Google, GE, and NBC Universal, and 99% of the Fortune 500. Lucid partners with industry leaders, including Google, Atlassian, and Microsoft. Since its founding, Lucid has received numerous awards for its products, business, and workplace culture. For more information, visit lucidchart.com.
Related articles
UML diagram templates and examples
UML diagrams may seem complicated, but the process of building one doesn't have to be. Get started with one of the UML templates available from Lucidchart. We've got class, component, object, activity, sequence, and use case diagrams all ready for you.
Create diagrams faster using automation features in Lucidchart
Working visually shouldn’t mean more work for you. Find out how to automate your diagramming with Lucidchart to help your teams do more faster.
How to create UML use case diagrams in Lucidchart
UML use case diagrams clarify requirements, detect problems, and simplify a system’s design. Learn how to create one!
Create UML class diagrams in Lucidchart
In this article, we will explain how to create a UML class diagram in Lucidchart plus offer free resources.
