UML diagram templates and examples
Reading time: about 4 min
Content
Content
From all the software engineers we've talked to, we've found a common theme: no one likes to create documentation. UML diagrams can be incredibly helpful when you need to onboard employees or reference source code during implementation, but they become outdated quickly and take hours to build—unless you use a UML diagram tool like Lucidchart.
We've compiled templates for three types of structural UML diagrams—class, component, and object diagrams—and three types of behavioral UML diagrams—activity, sequence, and use case diagrams. Find a template to document your systems faster than ever.
Want a primer before you get started? Learn about the 13 types of UML diagrams.
Learn moreClass diagram templates
Component diagram templates
Object diagram templates
Activity diagram templates
Sequence diagram templates
Use case diagram templates
Class diagram templates
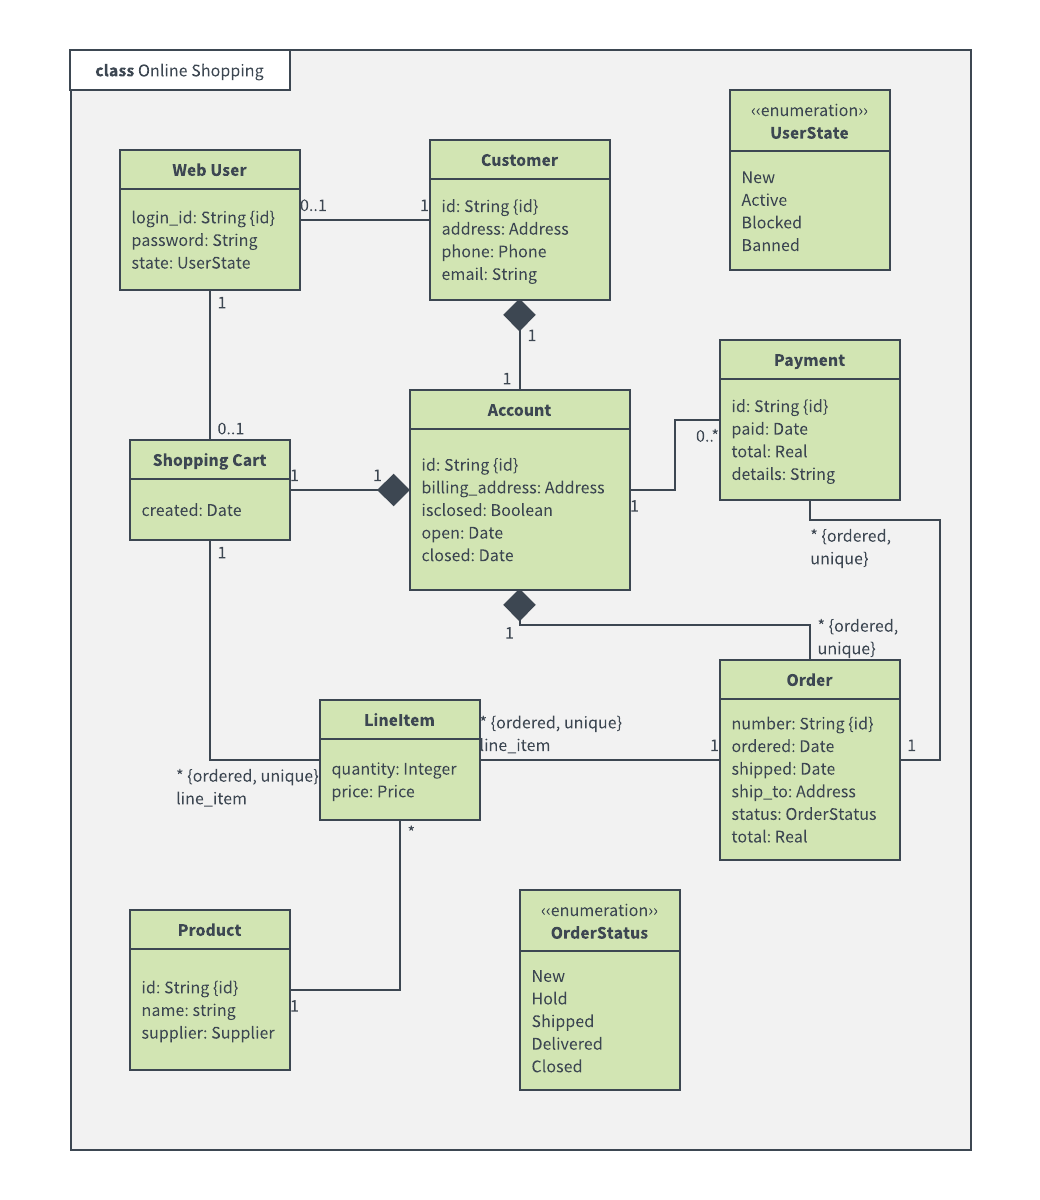
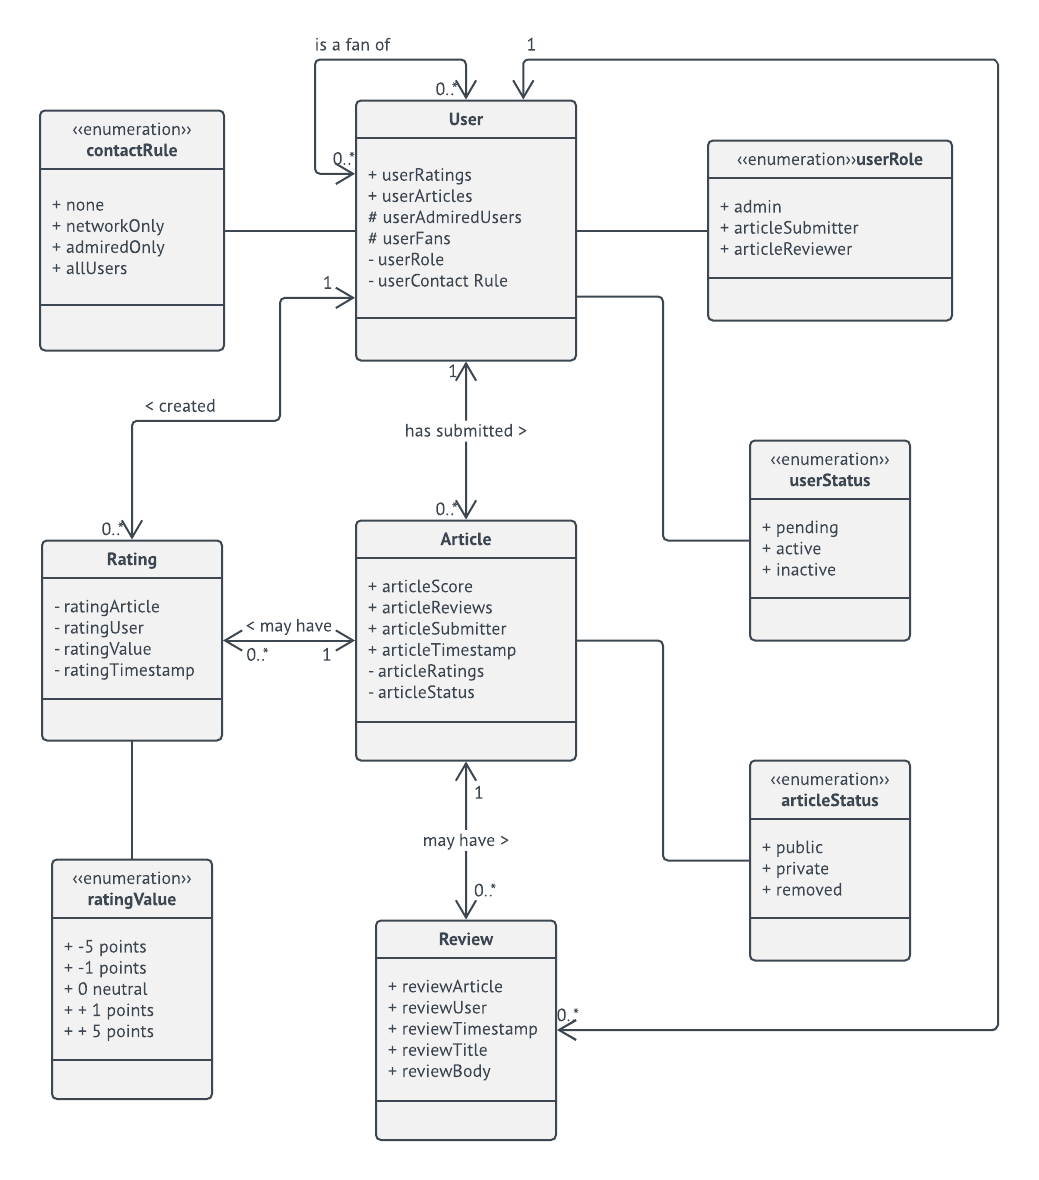
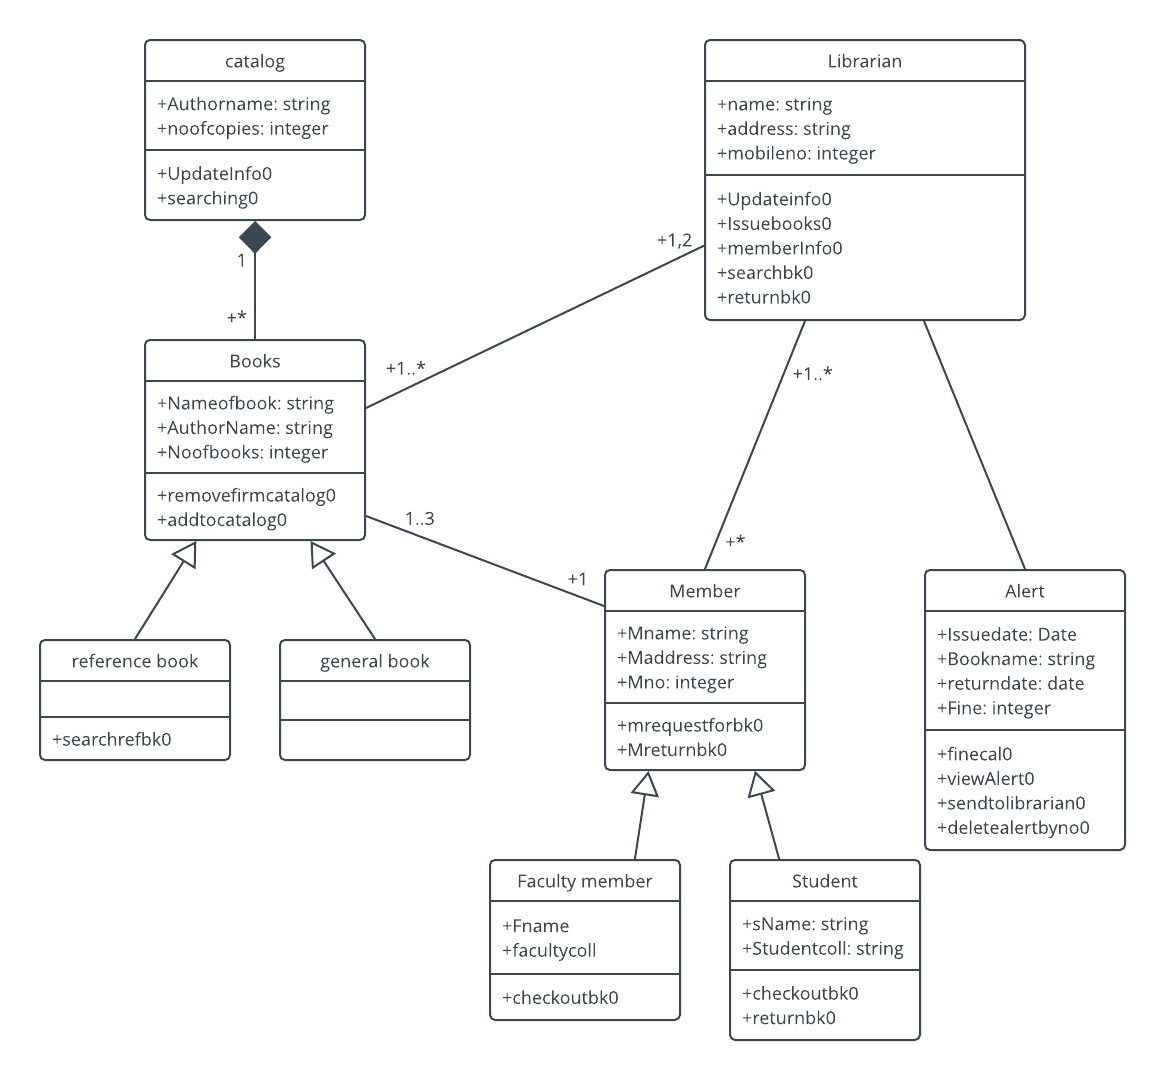
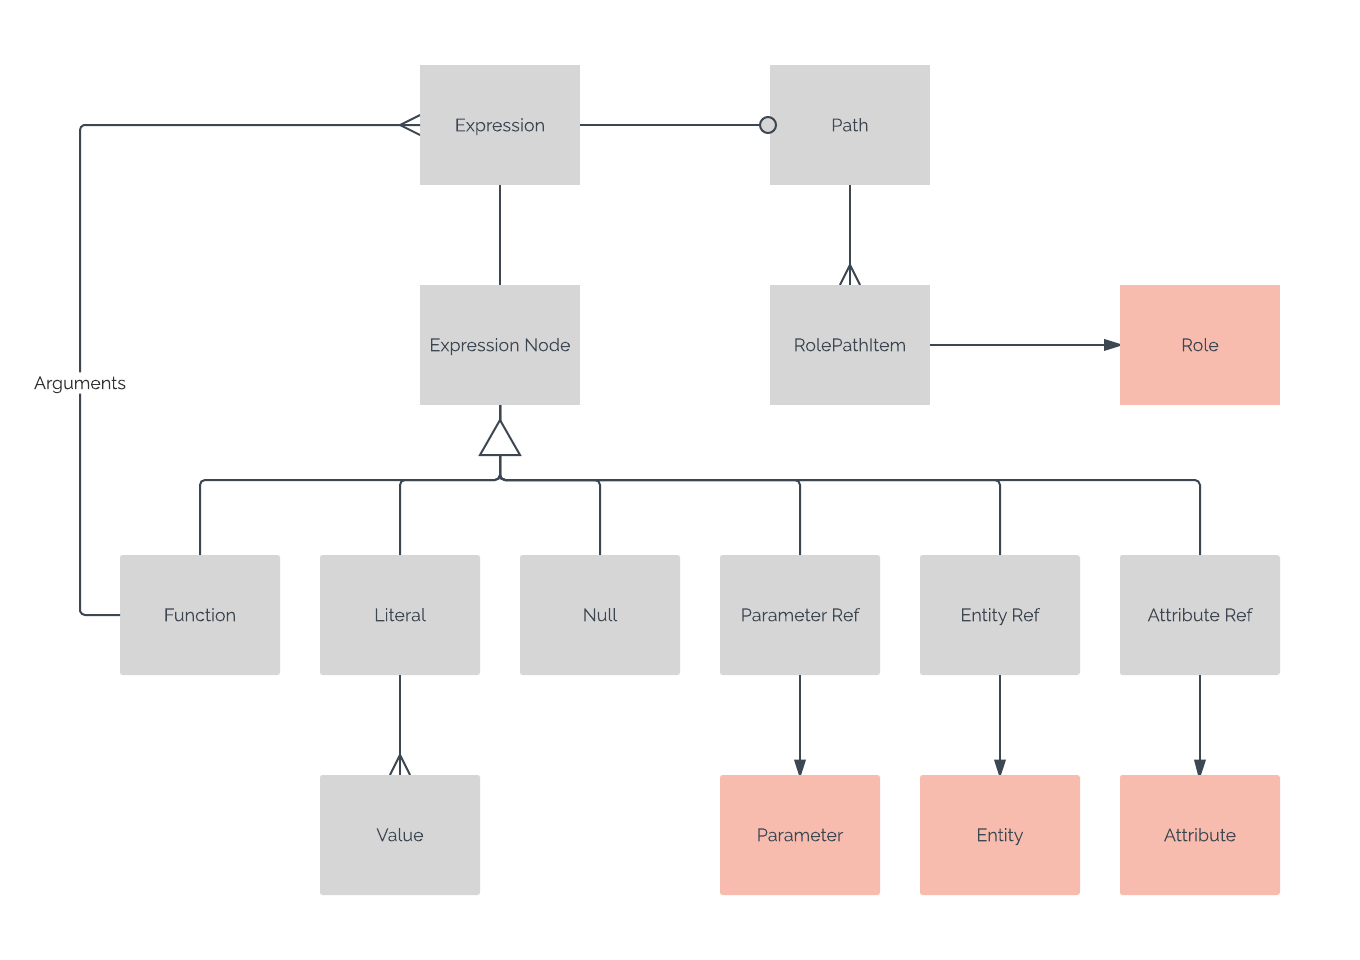
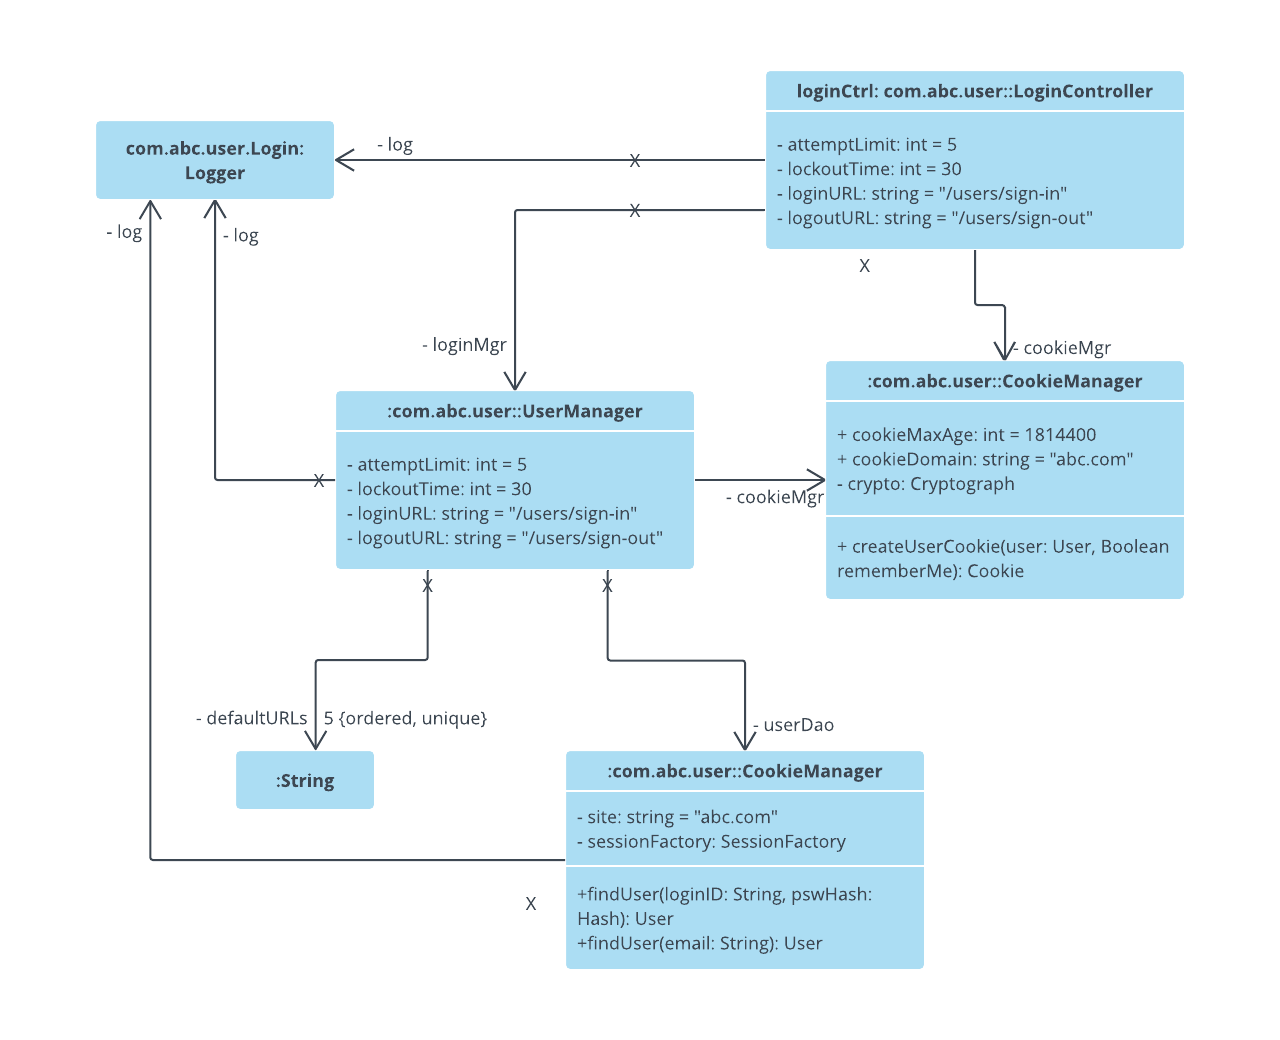
The class diagram is one of the most commonly used diagrams in UML, as explained in depth in our guide on class diagrams. Software engineers and business professionals often choose class diagrams to map the structure of particular systems because they clearly display the various classes, attributes, operations, and relationships between objects.
In our examples below, you'll find that each class shape is labeled with its name in the first row, the second row displays each attribute of the class on a separate line, and the third row displays each operation on a separate line. From there, additional UML symbols are used to model the various interactions and objects involved within the process.
Component diagram templates
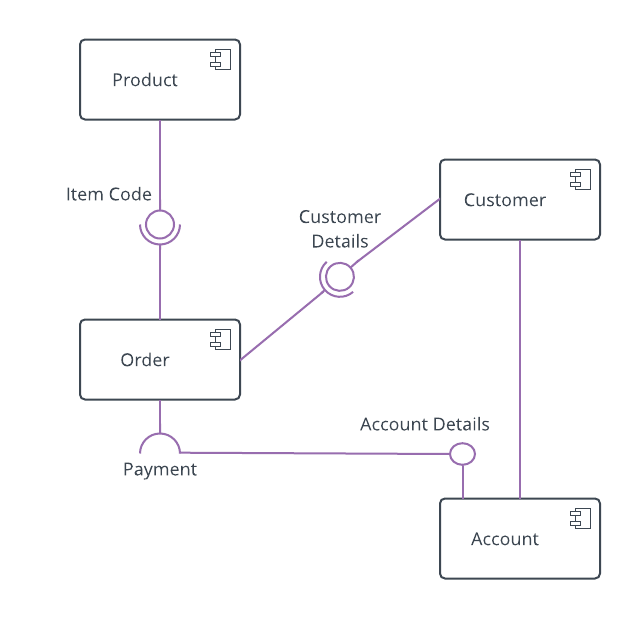
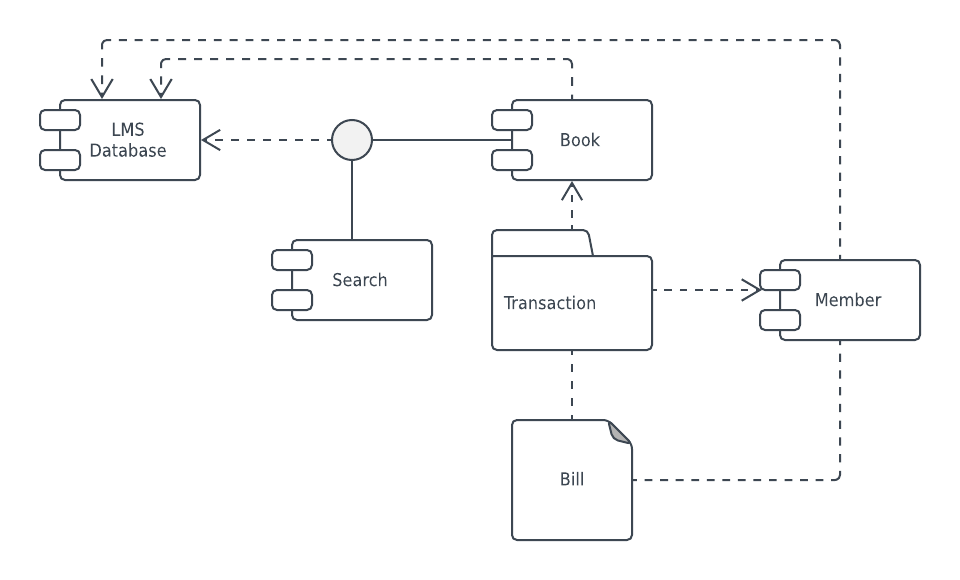
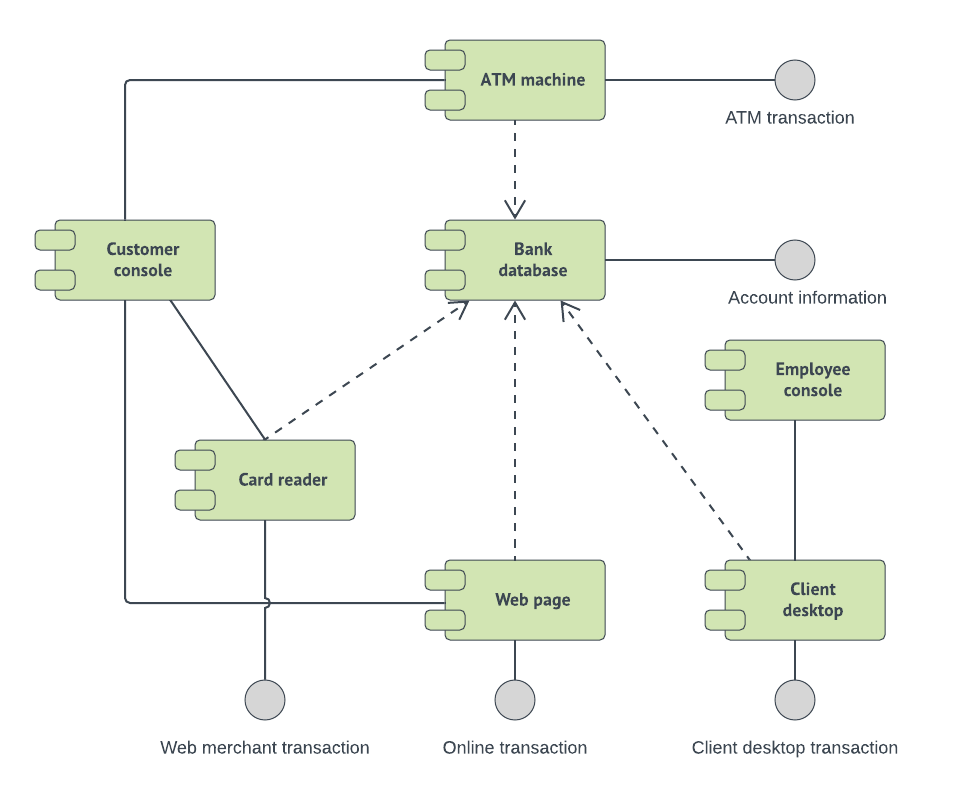
Component diagrams in UML are very similar to class diagrams. Both component and class diagrams display the structural relationship of software systems and their elements; however, component diagrams generally simplify the interactions within more complex systems. The components that make up this type of diagram are modular parts of the system that are inherently replaceable. Diagrams are structured this way so that the components can be easily replaced when needed.
The component diagram examples below show the structural relations between components in an online shopping system, library management system, and an ATM system. The connected circles, or “lollipop” symbols, represent realization relationships within the systems. Take a look at our examples below, and dive into our component diagram guide to become more familiar with component diagrams.
Object diagram templates
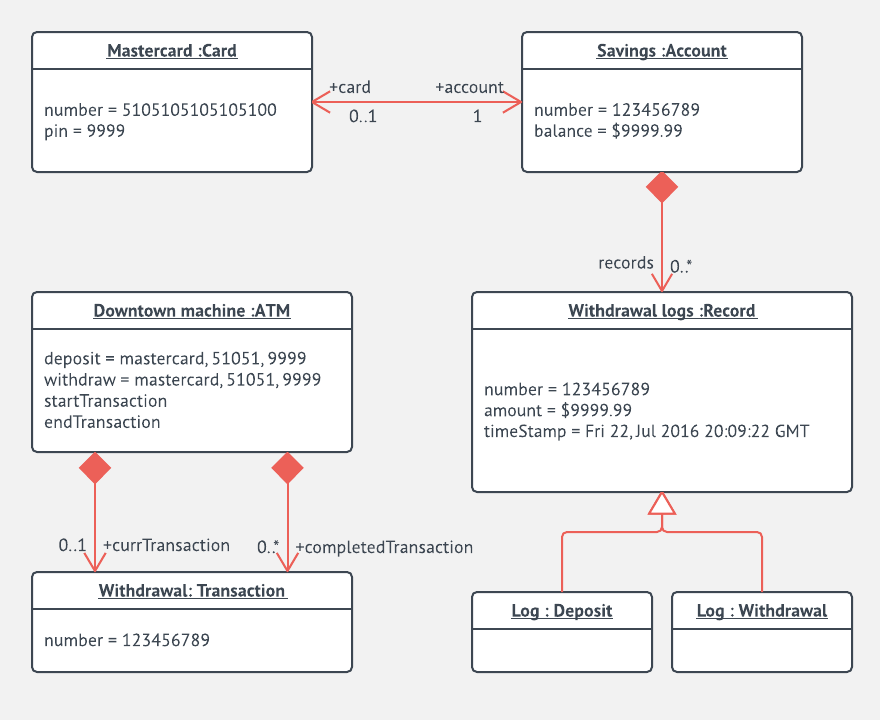
An object diagram in UML may look similar to a class diagram because it focuses on the attributes of a class diagram and how those objects relate to each other. For example, in the ATM template below, the class titles display the type of card, account, or action that the customer uses. The class attributes are all unique—in this case, the card has a specific number and PIN, the accounts and machines have their own specific numbers and amounts, and actions have specific transaction numbers.
Refer to our object diagram guide if you need more insight. With the rest of our object diagram examples, you'll see that these UML diagrams aren't just limited to banking systems. Try one out.
Activity diagram templates
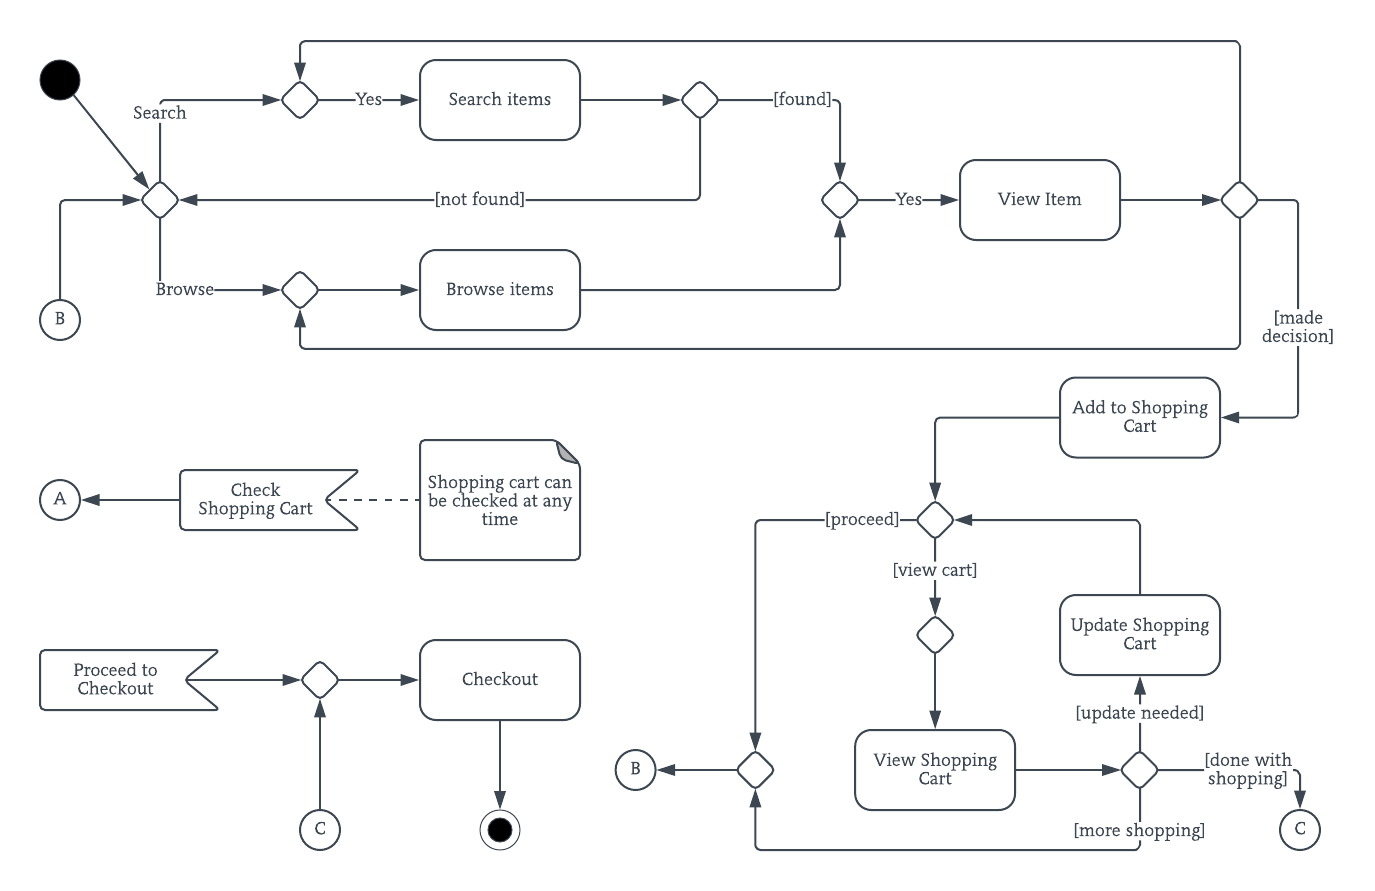
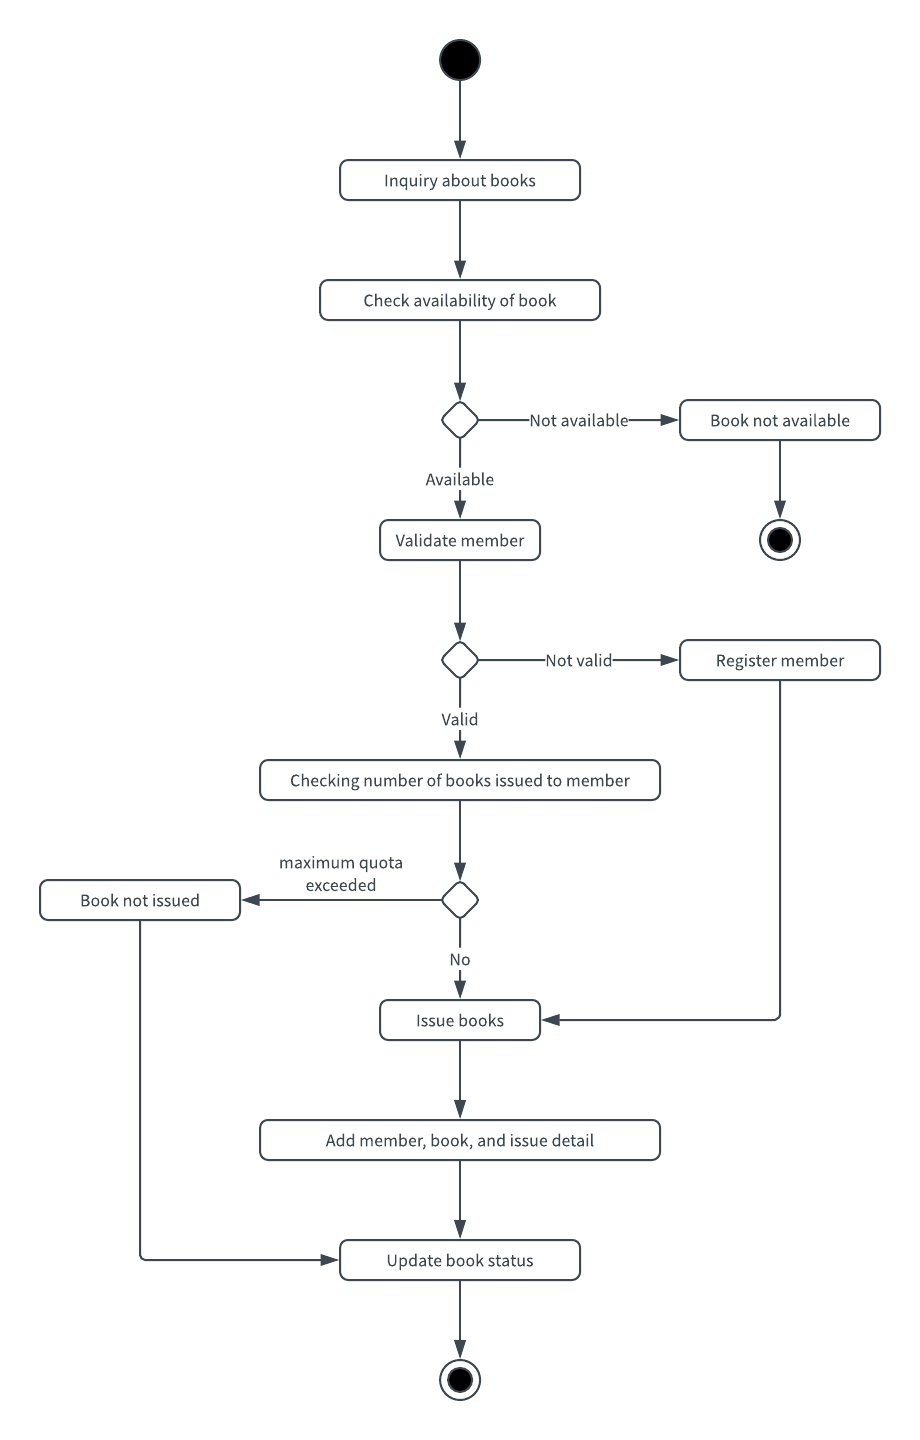
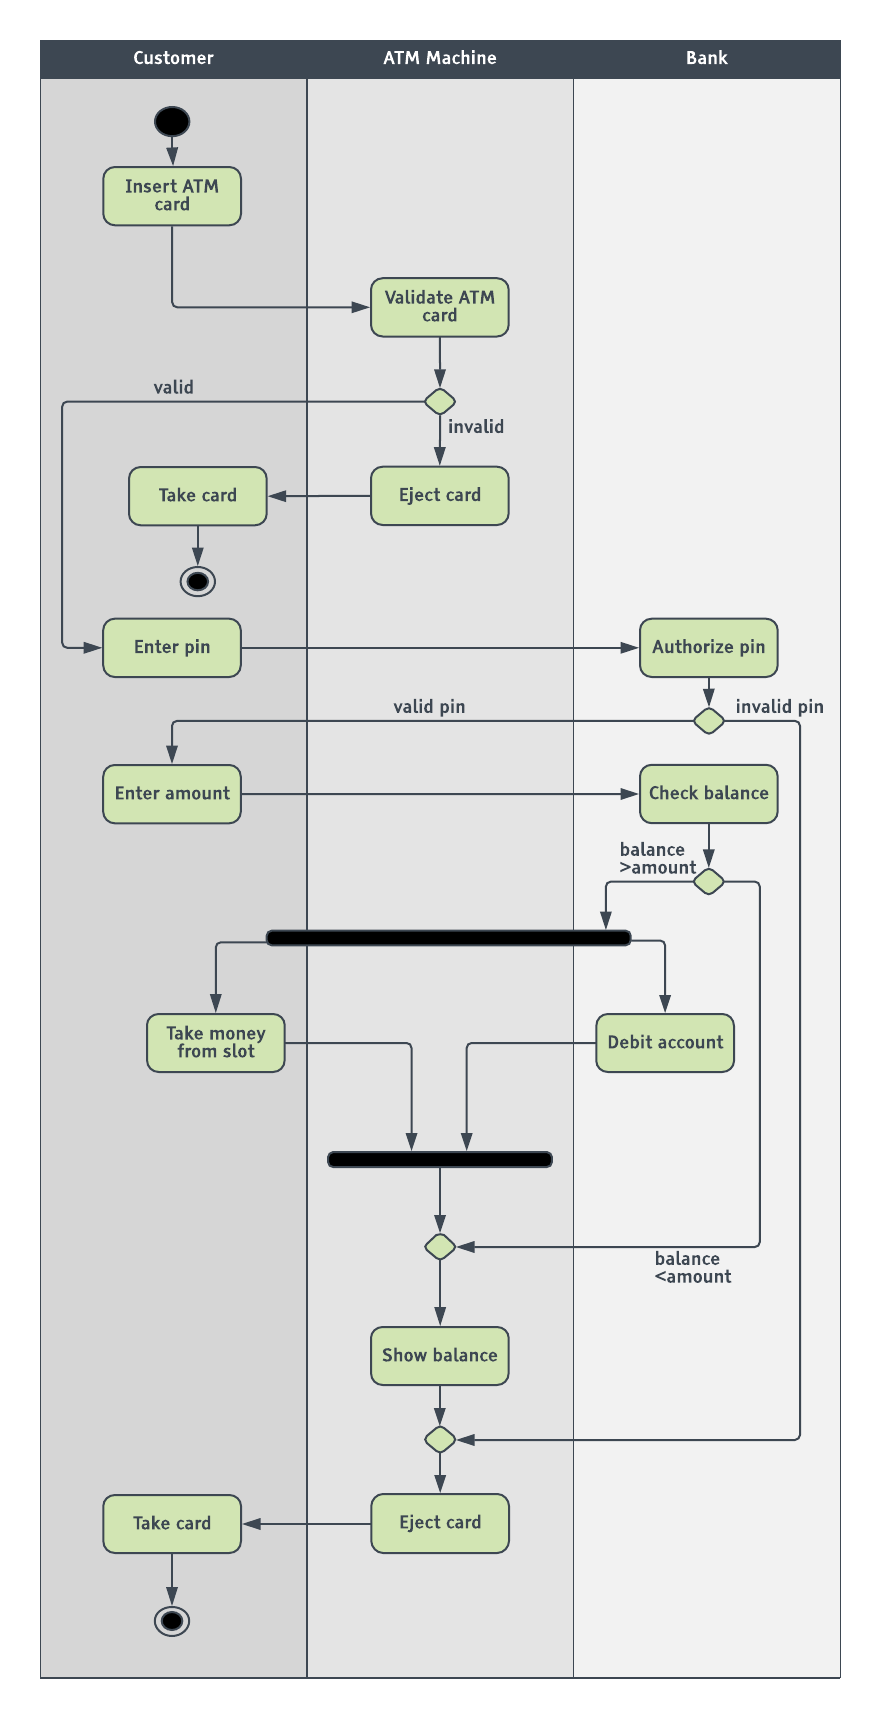
Activity diagrams in UML are a leading subset of behavioral diagrams. They display the functionalities of various activities and flows in business processes and software systems. With UML-specific symbols, you can map out the start point, end point, and all the merging and interactions in between your process flow. See our guide on activity diagrams if you need additional information.
Sequence diagram templates
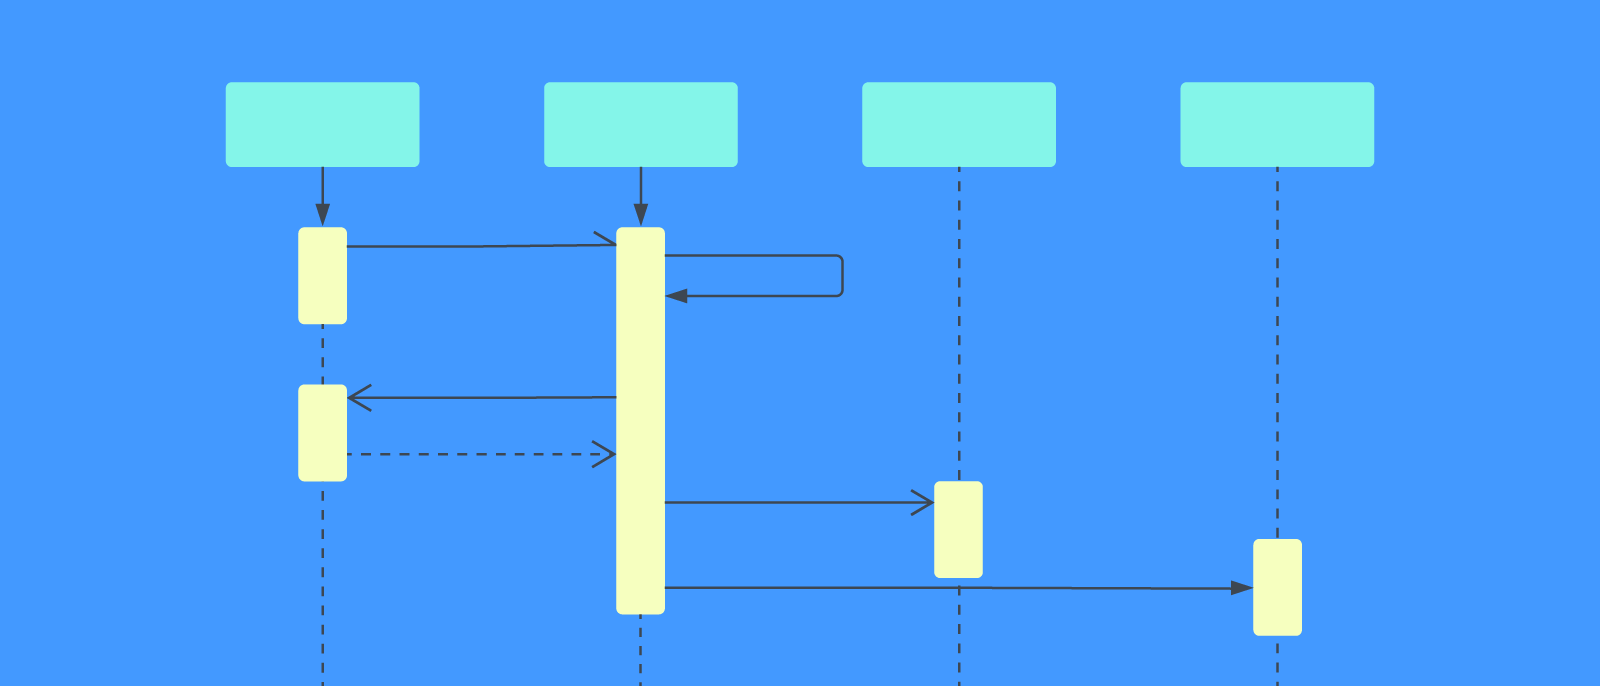
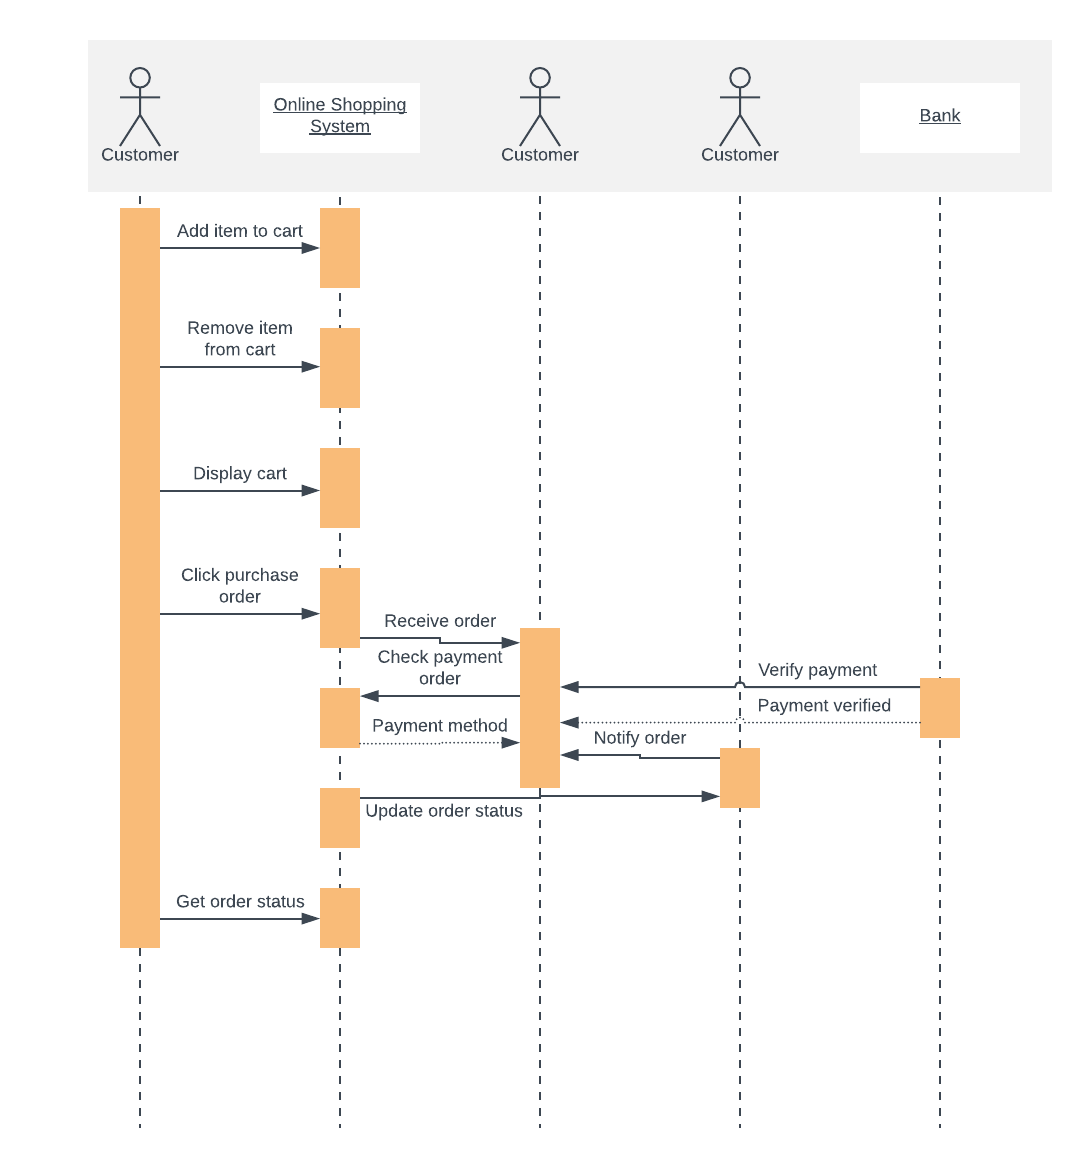
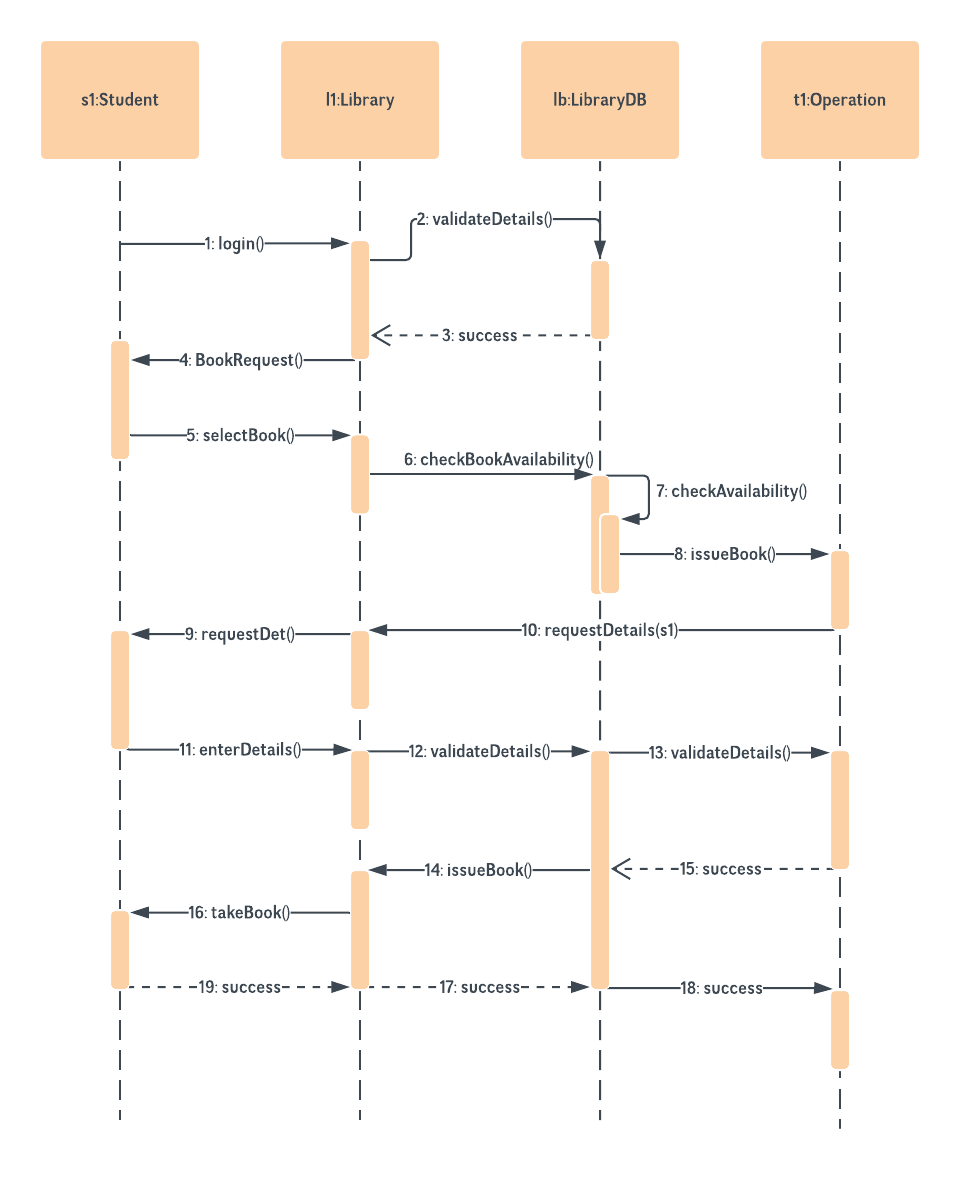
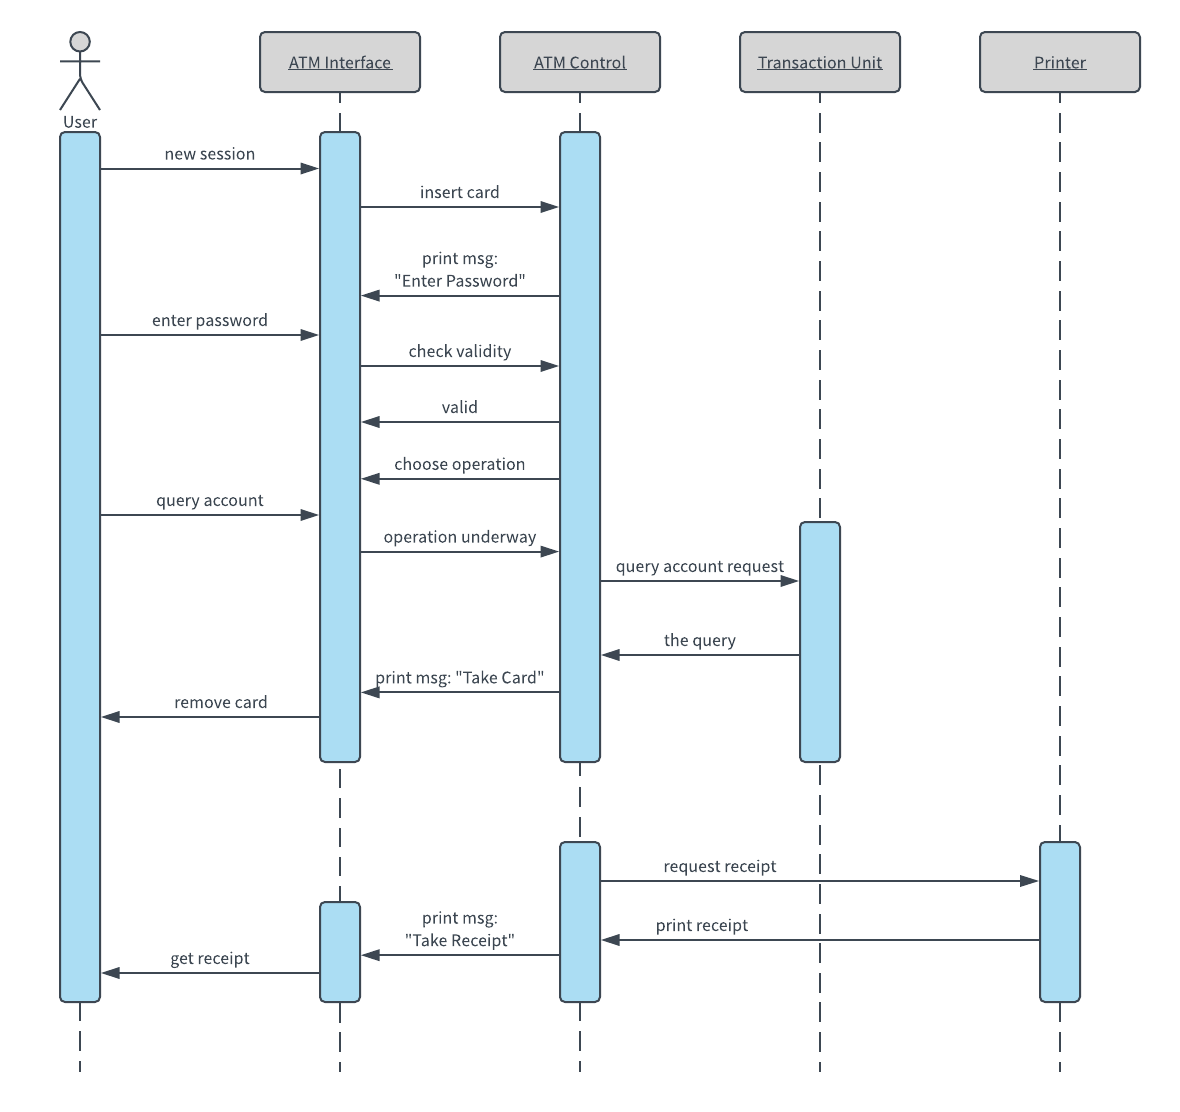
Many project managers and engineers use sequence diagrams in UML to get a better idea of how tasks within a project will function, overlap, and move between objects or components. Create sequence diagrams to display interactions between objects and the order in which those interactions occur.
You can read our full guide on sequence diagrams for additional reference. While the examples below cover UML sequence diagrams, Lucidchart still has the shapes and features you need to model code-based sequence diagrams as well.
(P.S. You can save even more time when you generate UML sequence diagrams from text markup in Lucidchart. Learn more about this feature.)
Use case diagram templates
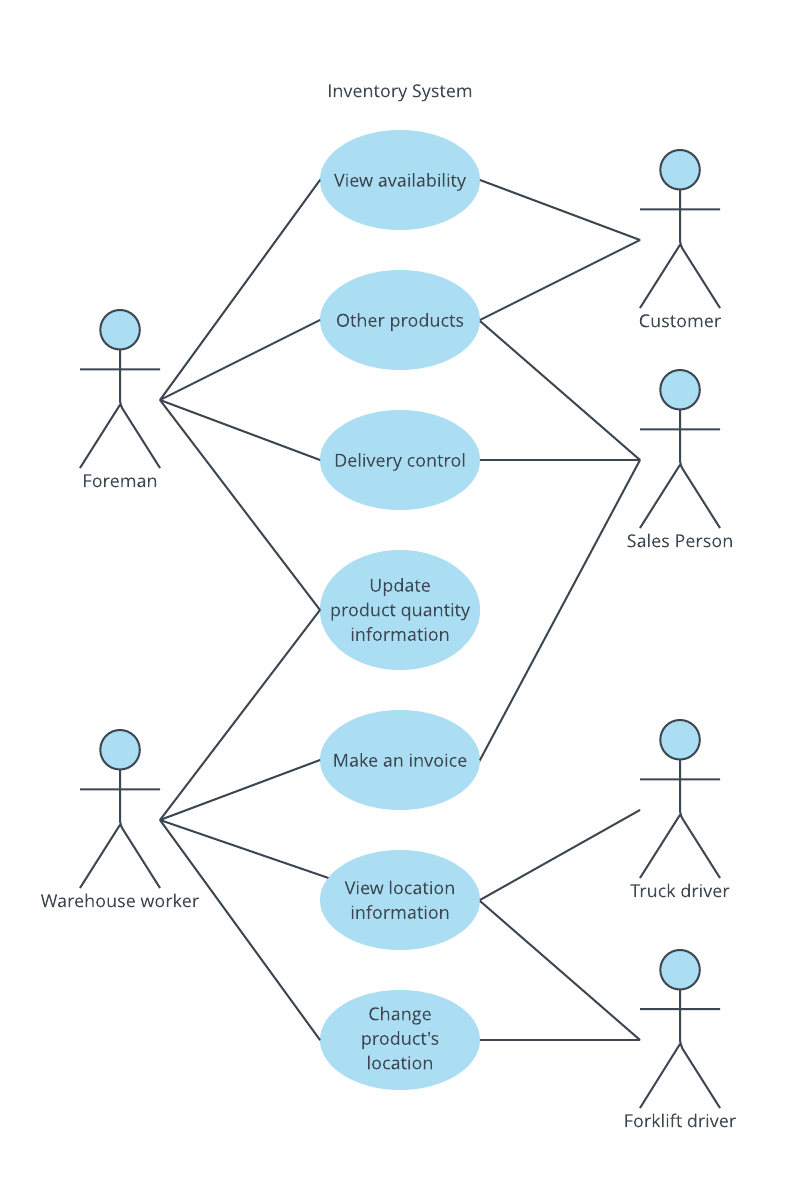
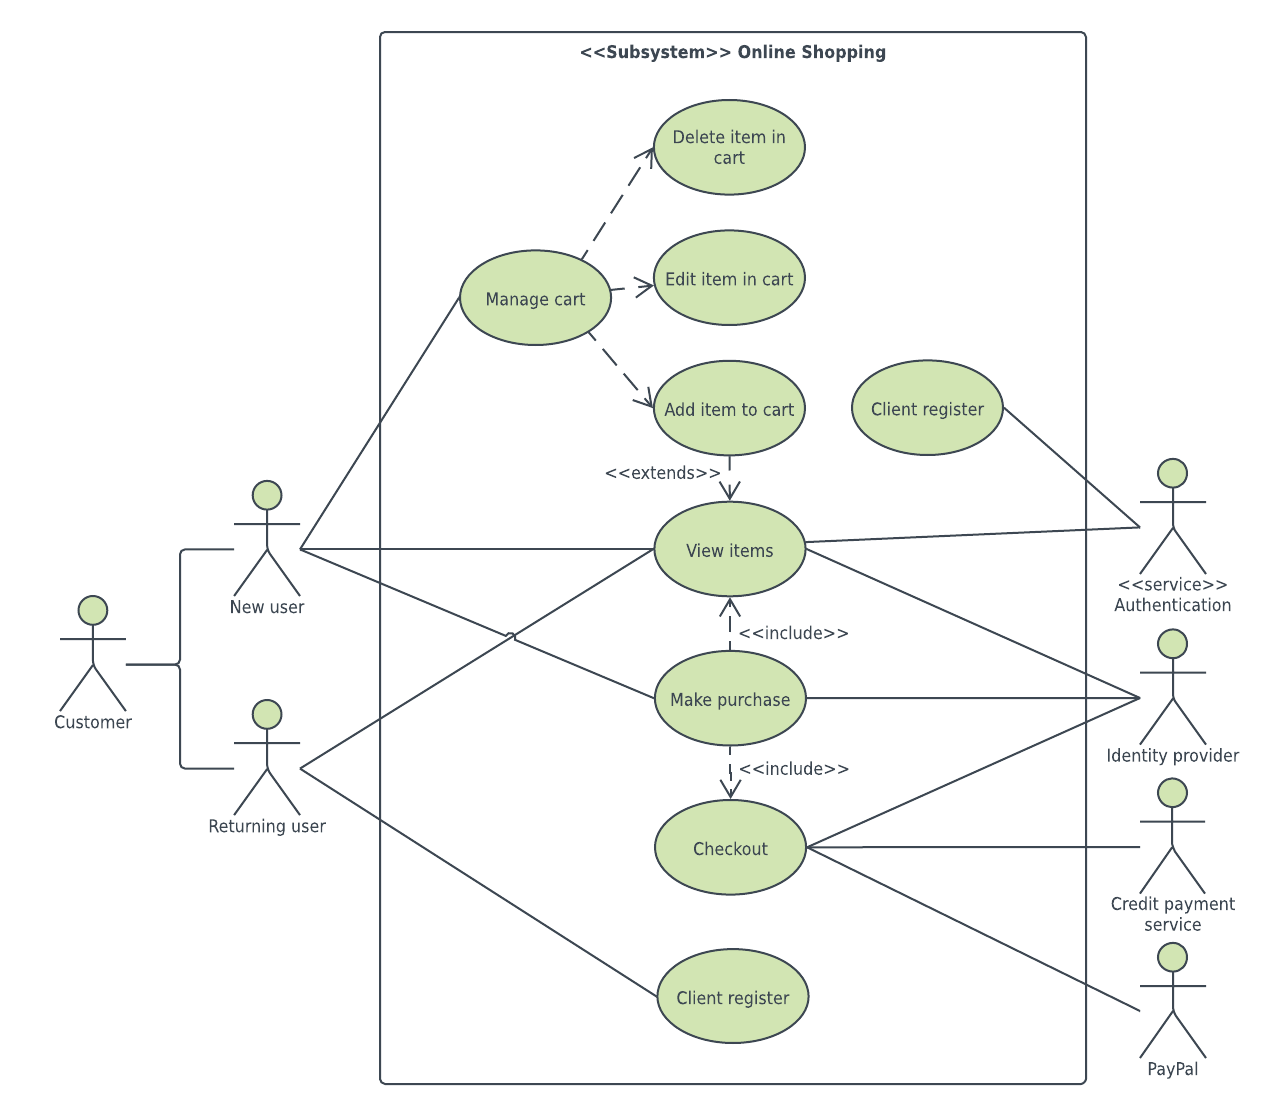
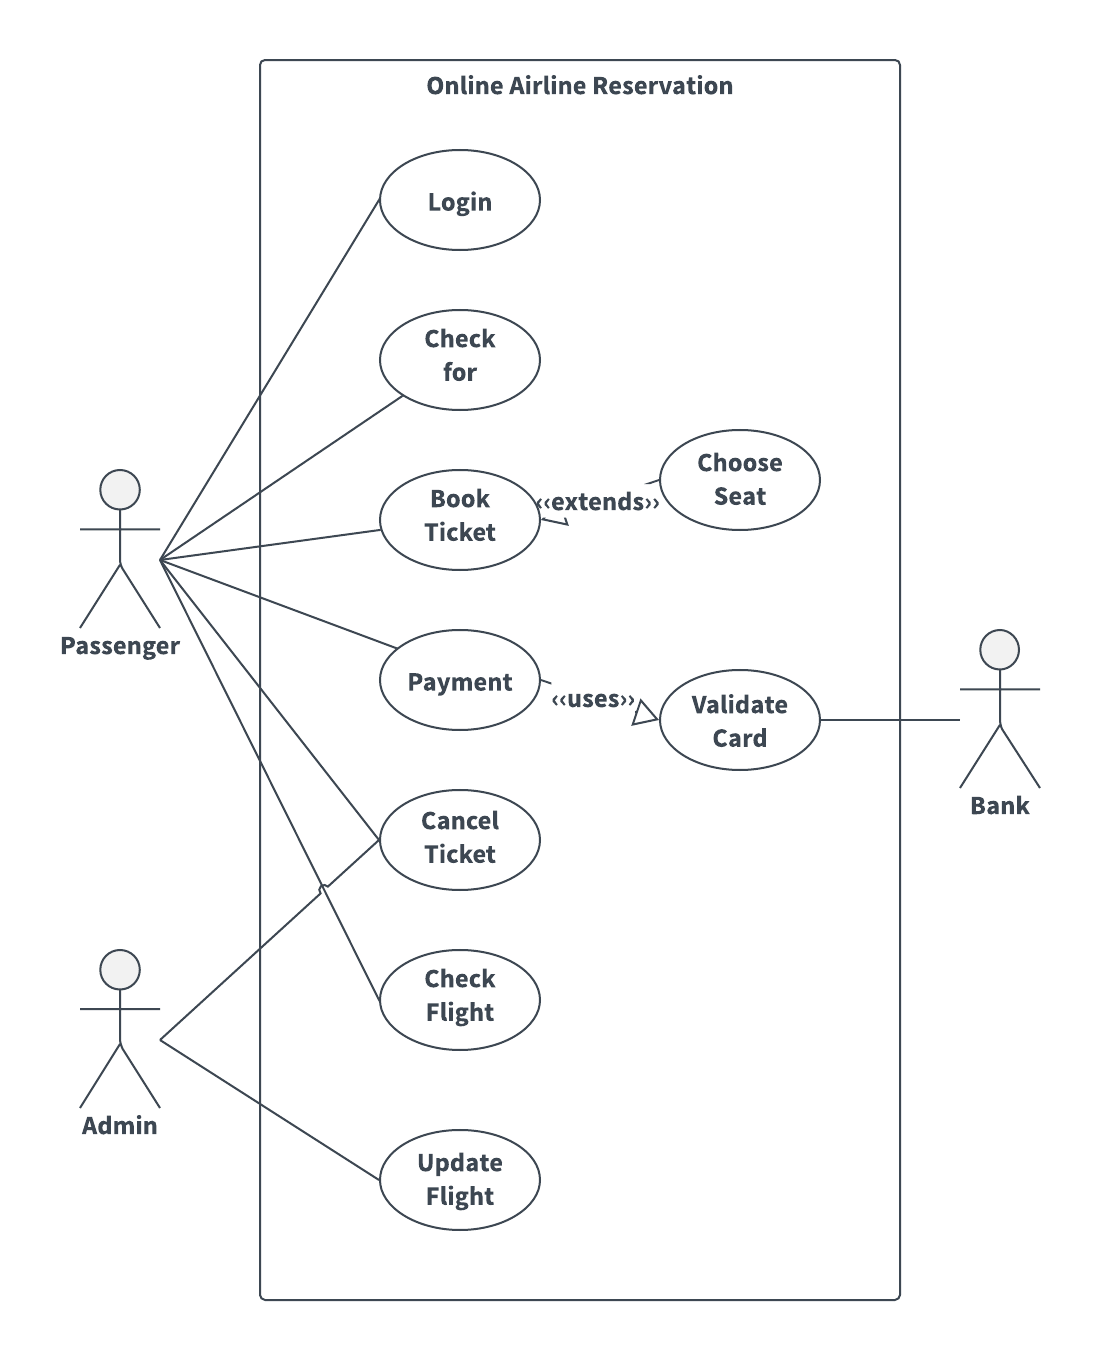
With a UML use case diagram, you can create a broad, high-level view of the relationship between use cases, actors involved, and systems being performed. Take a look at our use case diagram guide to learn more about the benefits of use case diagrams and the shapes involved.
As you can see from the examples below, use cases are represented by oval shapes, and the lines then show at which point an actor participates and interacts with their corresponding use case. You can see where each actor is involved within the entire process (and where they're excluded). For instance, in one of the examples, a truck driver needs to know the location information but doesn't need to be involved at any other part of the process within a successful inventory system.
UML diagrams may look complicated, but the process of building one doesn't have to be. Click on any of the templates above to get started.
Build UML diagrams to navigate source code and plan new features—our UML diagram tool makes the process simple and collaborative.
Learn howAbout Lucidchart
Lucidchart, a cloud-based intelligent diagramming application, is a core component of Lucid Software's Visual Collaboration Suite. This intuitive, cloud-based solution empowers teams to collaborate in real-time to build flowcharts, mockups, UML diagrams, customer journey maps, and more. Lucidchart propels teams forward to build the future faster. Lucid is proud to serve top businesses around the world, including customers such as Google, GE, and NBC Universal, and 99% of the Fortune 500. Lucid partners with industry leaders, including Google, Atlassian, and Microsoft. Since its founding, Lucid has received numerous awards for its products, business, and workplace culture. For more information, visit lucidchart.com.
Related articles
How Lucidites Use Lucidchart: Diagrams for Engineering
Many software engineers use diagrams to architect new applications and systems and to prepare documentation for troubleshooting and training. Our engineers at Lucid Software are no different. They diagram as they work hard to make diagramming (and designing on Lucidpress) easier for you. Check out how our engineers have applied Lucidchart in various aspects of their jobs.
Create diagrams faster using automation features in Lucidchart
Working visually shouldn’t mean more work for you. Find out how to automate your diagramming with Lucidchart to help your teams do more faster.
How to create UML use case diagrams in Lucidchart
UML use case diagrams clarify requirements, detect problems, and simplify a system’s design. Learn how to create one!
