Why you should create API diagrams
Reading time: about 6 min
Today, nearly 90% of software developers use APIs (or Application Programming Interfaces). And another 70% expect to increase API usage this year.
An API is a software intermediary that enables applications to communicate and share data within and across organizations. Because of their standardized governance, APIs are developer-friendly and broadly accessible.
However, while APIs have relatively simple components, their interactions with other applications and servers can be complex.
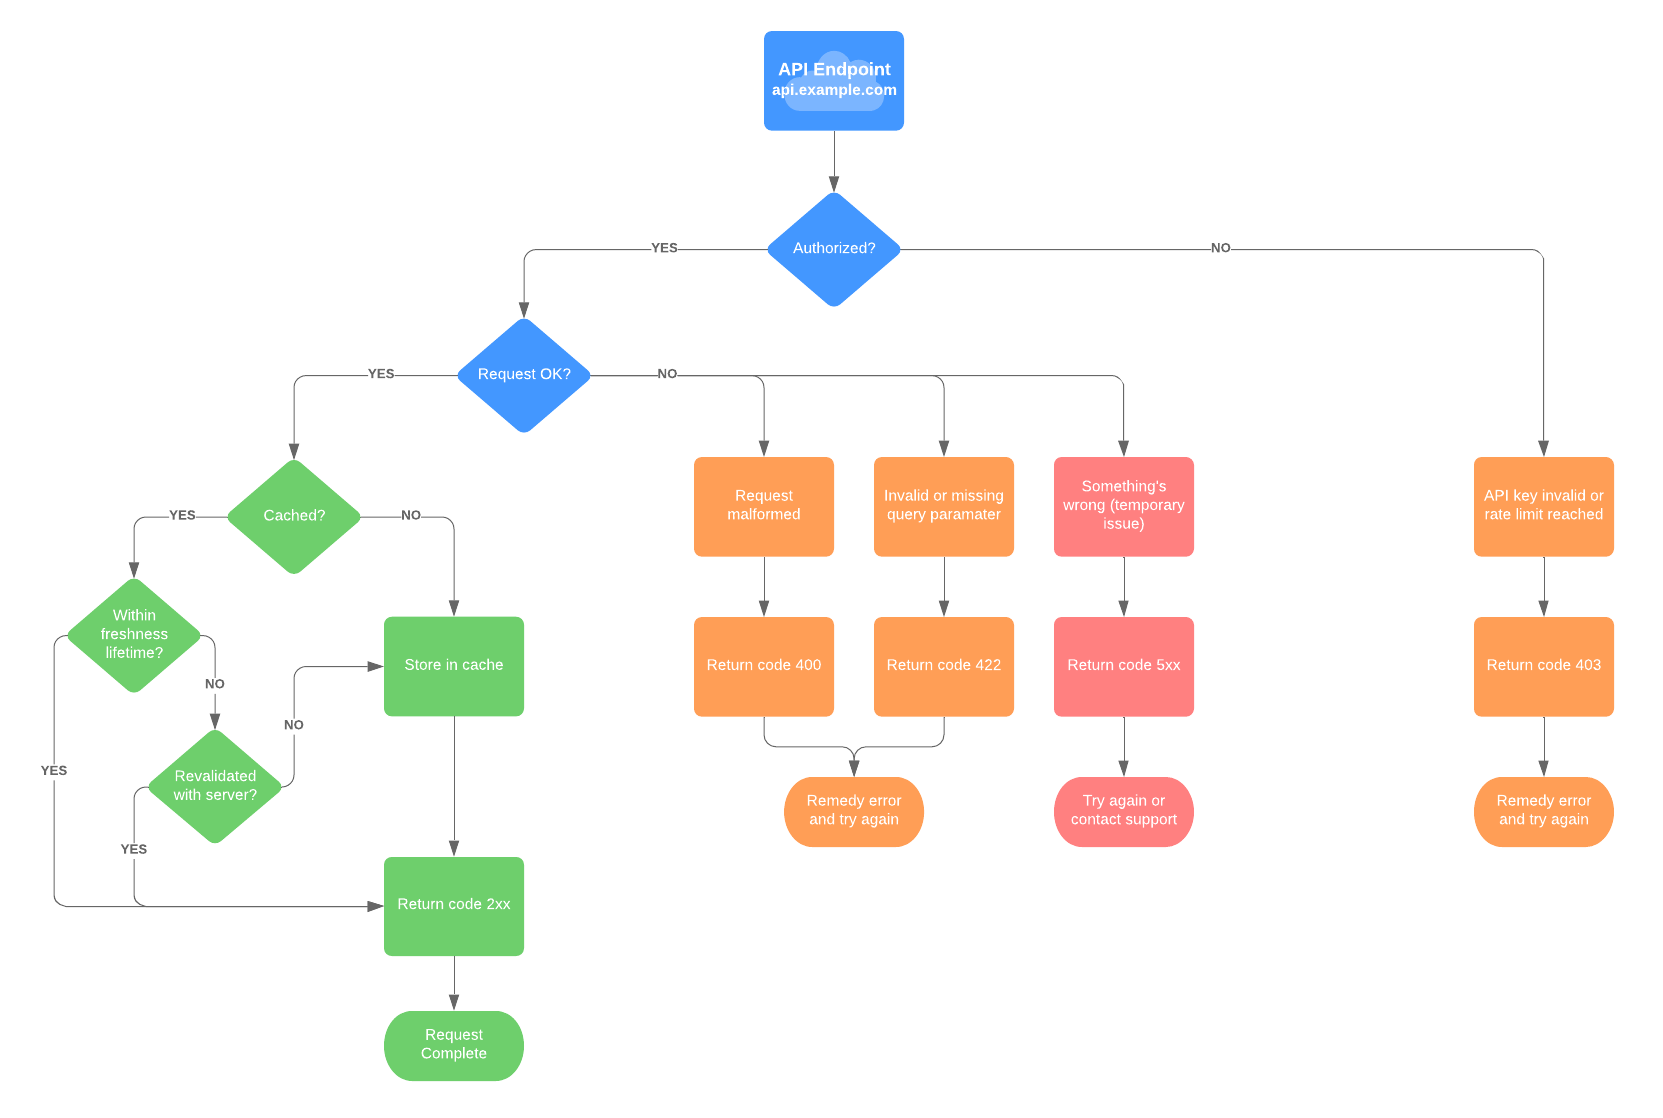
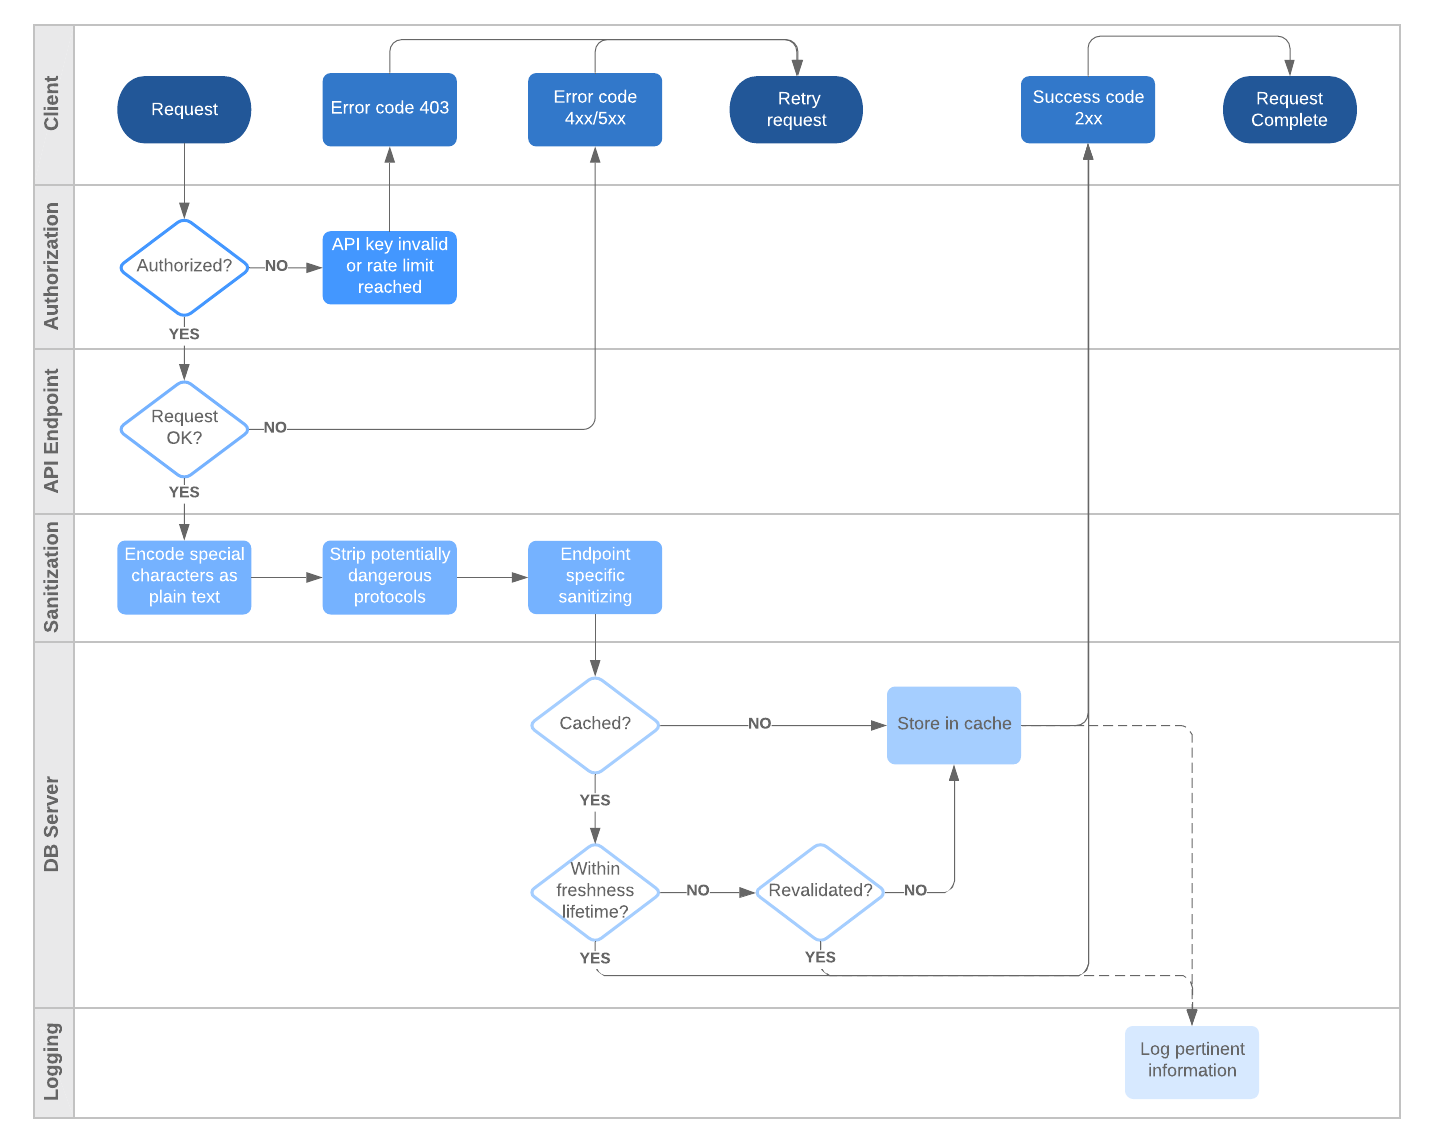
That’s where an API flow diagram can help.
Read on to better understand what an API is and the benefits of using an API flow diagram to iterate ideas and model your plans during development.

What is an API?
An API is a set of routines, protocols, and tools developers use to build software applications and to specify how software components should interact. In simple terms, an API is a messenger that sends a request to a provider you want data from and then delivers the response back to you. Think of an API as an intermediary that allows two programs to talk to each other.
In web development, an API allows applications to “piggyback” on other services. For example, nearby restaurants are displayed on Google Maps when you use the Yelp app, and some video games let you chat with friends and invite other players to play via Facebook.
To make communication and data sharing possible, an API exposes limited parts of a program’s interface so a specific set of features can be accessed and used by other programs. The applications are able to share data and take actions on each other without requiring developers to share their entire code.
This is what makes APIs so valuable—and why so many developers use them. They enable data sharing at scale and are the key mechanisms for exchanging value in digital economies
Why create an API diagram?
While an API itself is often composed of simple components, developing an API can be complicated, and you need to be very organized in order to develop one. You’ll need to determine what you want the API to be, what its function is, and what data it will need to grab.
An API flow diagram can help you:
- Brainstorm and document your ideas
- Visualize data flows and relationships
- Iterate through revisions more easily
As you brainstorm, great ideas can come quickly. These ideas can leave just as quickly if you don’t record them. An API diagram can help you visualize and organize those ideas so you can build on them with your team.
Use an API diagram to think about and record key decisions such as:
- What calls are you using for each API?
- What order do they go in?
- What will other developers need from your API to integrate?
- How can you make it as simple as possible for them to access?
- How will errors be handled?
Keep in mind that not everybody on your team is as technical as you are. So as you work with product managers and other stakeholders, making a visual representation of your ideas helps keep everybody on the same page. Visuals like an API diagram make the information more accessible and easier to understand while encouraging collaboration.

A visual flowchart is a good way to map out how you want your API to function. Lucidchart can help you create a web-based flowchart that is centrally located. Everybody involved with the project can easily access the document and from anywhere in the world as you collaborate and update in real time.
Use UML to model your API
An API flowchart should be a high-level overview of what the API needs to accomplish. You can take that a step further by diagramming a model of how the software will actually function. Visualizing the API makes it easier for your team to understand and digest the information and can save you time as you define system flow and model potential outcomes. Modeling may also help you find necessary calls or actions that you hadn’t thought of before.
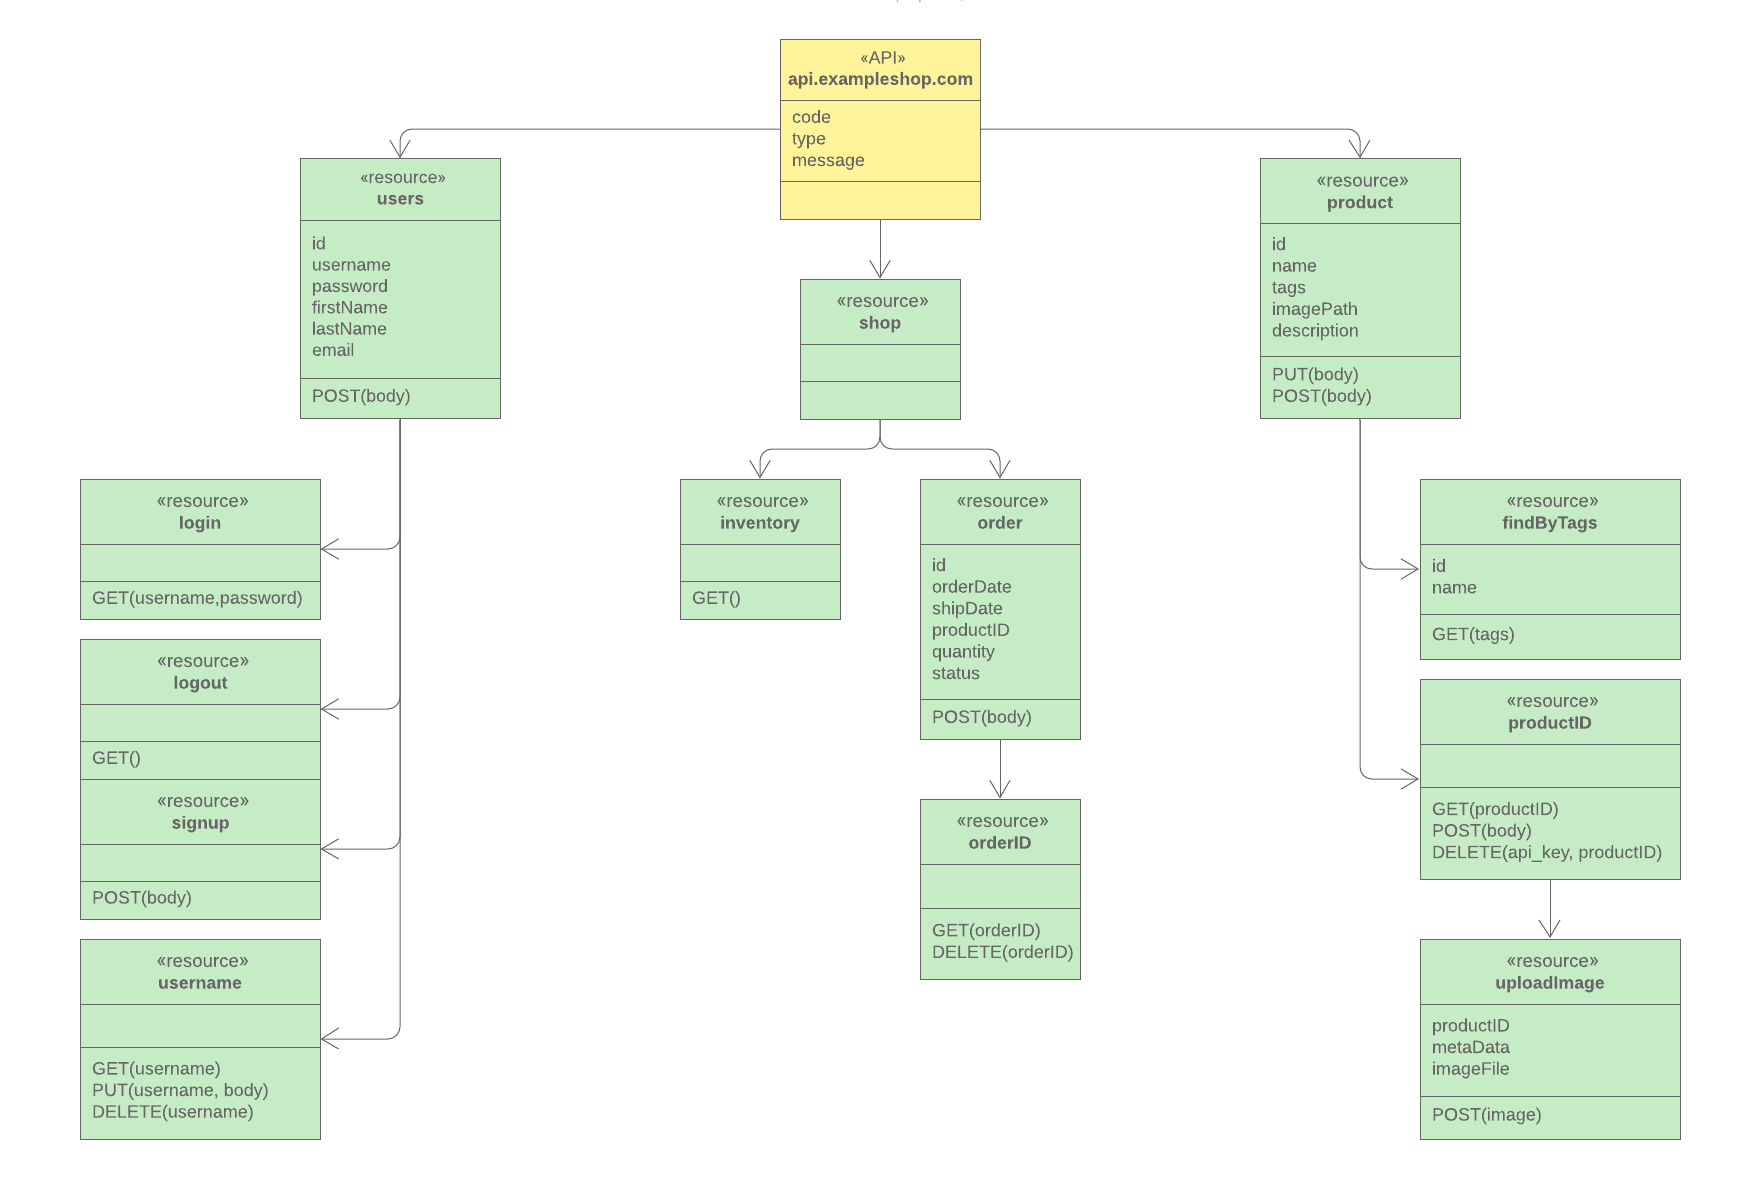
Using Unified Modeling Language (UML) is a common and standard way to visualize complex software structures. With UML, you can design a model of your API before you ever write a line of code. Like a blueprint is drafted before the construction crew pours a foundation, UML acts as a blueprint for diagramming a model for your API development.
When you use a UML diagram tool like Lucidchart, you can plot the relationship between objects, and define the attributes or code snippets that will accompany those objects. They also allow you to plan or expose behavioral functions of your software.

There are 14 different types of UML diagrams. As you plan your API model, you may need to use a collection of different UML diagram types to get a complete, overall picture of what your API is about.
The 14 diagram types are organized into two groups: structural diagrams and behavioral (or interaction) diagrams.
Structural diagrams
- Class diagram: This diagram represents the static structure of a system. It shows relationships between classes, objects, attributes, and operations.
- Component diagram: A component diagram displays the relationships of software components, including source code, run-time code, and executables.
- Deployment diagram: These diagrams represent the hardware and software resources in your system. A deployment diagram is useful for mapping how a software solution will be deployed across multiple machines and platforms.
- Object diagram: These show the relationship between objects using real-world examples. They display a representation of what a system looks like at any given time. These diagrams can be used to test class diagrams for accuracy.
- Package diagram: A package organizes elements into groups. A package diagram shows the dependencies among different packages.
- Profile diagram: These diagrams describe profiles that allow adaptation of the UML metamodel for different platforms and domains.
- Composite structure diagram: This diagram displays the internal structure of a class.
Behavioral diagrams
- Use case diagram: These diagrams model the functionality of a system and the actors who are involved in the system and its functionality. Actors are real-world examples such as customers, agents, and companies.
- Activity diagram: Activity diagrams are used to diagram the workflow from one activity to the next.
- State machine diagram: Similar to activity diagrams, state machine diagrams describe the behavior of objects that act differently according to their current state.
- Sequence diagram: Like the name implies, sequence diagrams map the sequence of when and how objects interact with each other.
- Communication diagram: These diagrams map the flow of messages passed between objects.
- Interaction overview diagram: This type of diagram shows the sequence of a collection of interaction diagrams.
- Timing diagram: These diagrams represent the behavior of objects within a specified time frame.
How can Lucidchart help?
Lucidchart is an essential UML diagram tool used by engineers and technical teams everywhere. It offers several templates and dedicated shape libraries for building structural and behavioral UML diagram types. You can even automatically generate UML sequence diagrams from text markup to save time during creation. With real-time collaboration, you can easily share your UML diagrams so your team can make changes as necessary or simply refer to your API source code.

Build diagrams with ease in Lucidchart.
Sign up freeAbout Lucidchart
Lucidchart, a cloud-based intelligent diagramming application, is a core component of Lucid Software's Visual Collaboration Suite. This intuitive, cloud-based solution empowers teams to collaborate in real-time to build flowcharts, mockups, UML diagrams, customer journey maps, and more. Lucidchart propels teams forward to build the future faster. Lucid is proud to serve top businesses around the world, including customers such as Google, GE, and NBC Universal, and 99% of the Fortune 500. Lucid partners with industry leaders, including Google, Atlassian, and Microsoft. Since its founding, Lucid has received numerous awards for its products, business, and workplace culture. For more information, visit lucidchart.com.
Related articles
4 phases of rapid application development methodology
Rapid application development (RAD), an agile project management strategy, offers fast project turnaround in fast-paced environments like software development. Learn more about RAD methodology and its benefits.
Types of UML diagrams
Want to start using UML for technical documentation? This article will introduce (or give you a refresher) on the different UML diagram types, as well as provide UML examples that you can open and edit in Lucidchart.
