7 Gantt Chart Alternatives
Project managers commonly use Gantt charts to track project schedules and show the dependencies between tasks. Some claim that Gantt charts are irreplaceable in project management and spend thousands of dollars on expensive Gantt chart software.
But frankly, Gantt charts come with a series of fatal flaws that leave many managers looking for other tools to meet their needs. Learn more about the disadvantages of Gantt charts and top Gantt chart alternatives you can try on your next project.
Gantt charts in project management
Developed by Henry Gantt in 1915, Gantt charts are a type of bar graph that displays tasks over time to illustrate the project's schedule. Gantt charts are often used to highlight task dependencies to keep the project on track.
But that is easier said than done – and Gantt charts come with some big disadvantages.
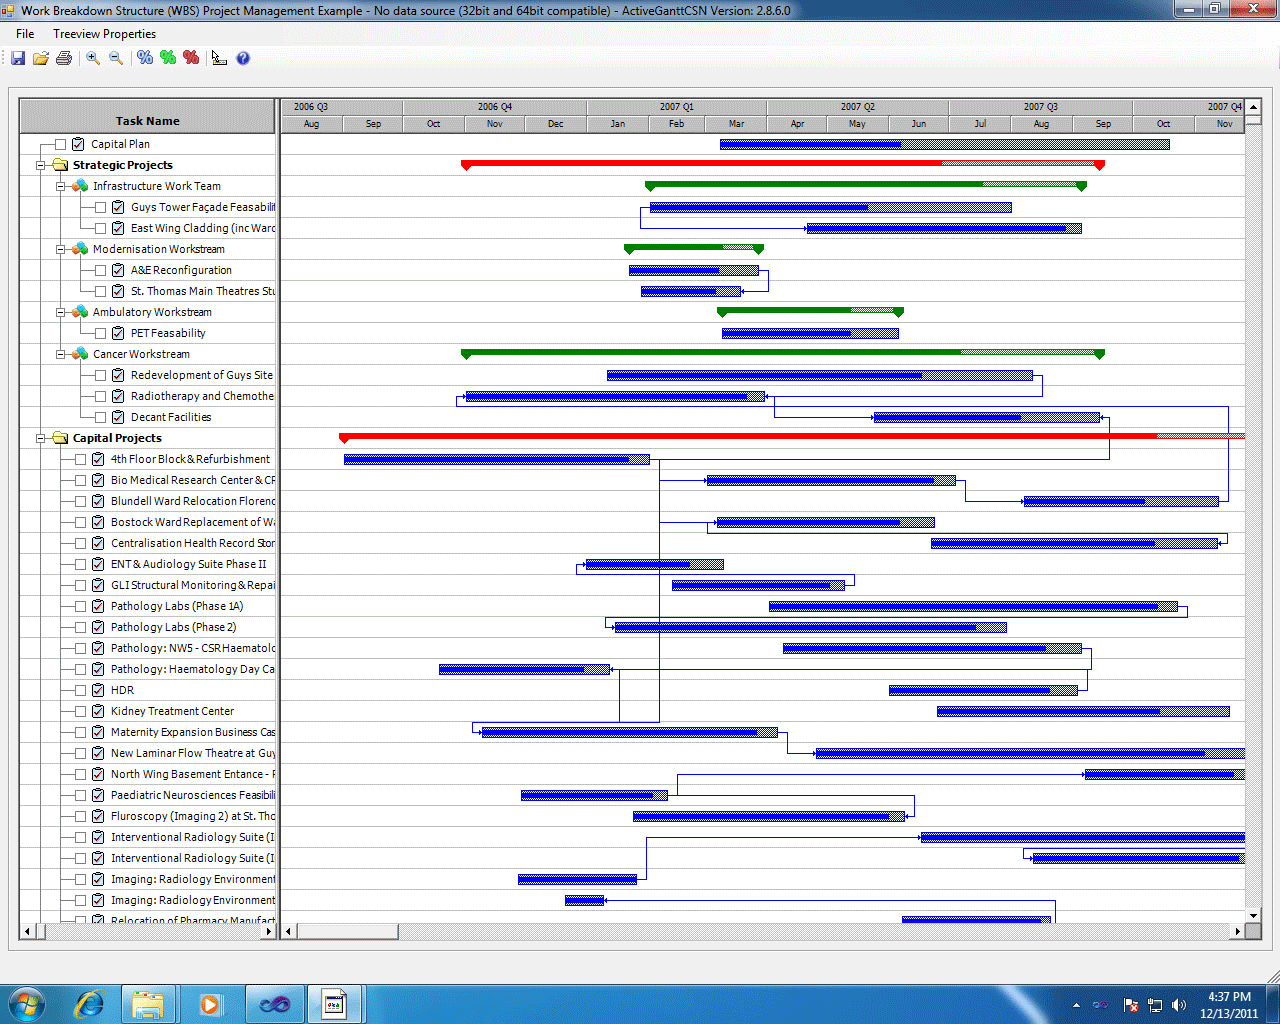
Disadvantages of Gantt charts
- Gantt charts are messy and hard to understand. Once you’ve added dependencies, resources, milestones, and deadlines, Gantt charts become a massive eyesore. Stakeholders may have difficulty understanding your diagram without a headache.
- Gantt charts are inflexible. In the era of agile project management, it doesn’t make a lot of sense to use a diagram requiring extensive pre-planning when your plans are likely to change.
- Gantt charts require a lot of work to update. In conjunction with #2, when your plans do change, updating your Gantt chart to match them takes time and often slips through the cracks. For this reason, Gantt charts are frequently outdated and hinder effective team communication.
- Gantt charts often mean expensive software. If you buy project management software and only use it to make Gantt charts, you could save a lot of time and money by exploring Gantt chart alternatives.
- Gantt charts are difficult to build collaboratively, share, and print. Most project management software makes it difficult, if not impossible, to build Gantt charts collaboratively. Once you build them, they are difficult to print and share.
Gantt chart alternatives for project management
If you find yourself nodding your head as you read this, it’s time for you to try Gantt chart alternatives.
To get you started, each of these options comes with a template that you can use in Lucidchart. In our web-based visual workspace, you can easily build professional diagrams and share with your team to collaborate in real time.
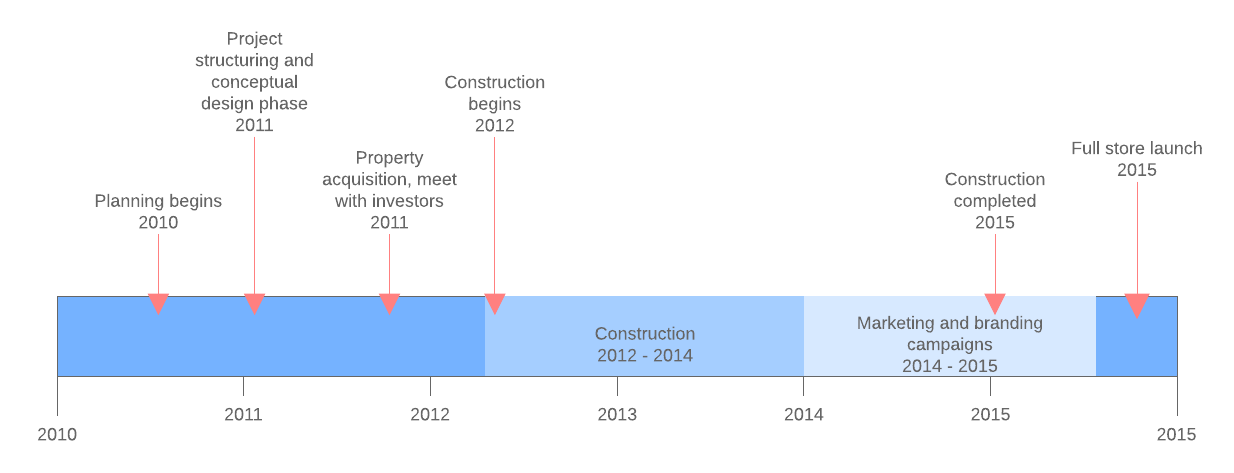
1. Project planning timeline
A project planning timeline shows a chronological sequence of events without the complicating details of a Gantt chart. They lend themselves to high-view conversations with stakeholders that don’t need to be overwhelmed with team assignments, limiting resources, and dependencies.
Try using this project management timeline template in Lucidchart. It's easy to understand and can be modified quickly as your plans change. Simply adjust the start and end dates in the advanced shapes menu, and then drag and drop project blocks and milestones to reflect modified deadlines.
2. Project network diagram
Another option is a project network diagram. As an alternative to Gantt charts, project network diagrams are used to scope a project and determine your project's critical path. The critical path is the longest path in your diagram use to help you determine how long the project will take. With project network diagrams, you can track dependencies as well as details such as task identification number and allocated resources.
Some managers avoid network diagrams because they don’t like to rearrange boxes and arrows as plans change. However, Lucidchart allows you to share diagrams with your entire team so they can update the original document instantaneously instead of sending you revisions that pile up in your inbox. You don’t have to be overwhelmed with paperwork, nor do you need to sacrifice program flexibility by choosing project network diagrams as your Gantt chart alternative.
Project network diagrams are often called PERT charts because they are used with the Program Evaluation and Review Technique. See how PERT charts compare to Gantt charts for project management.

3. Kanban board
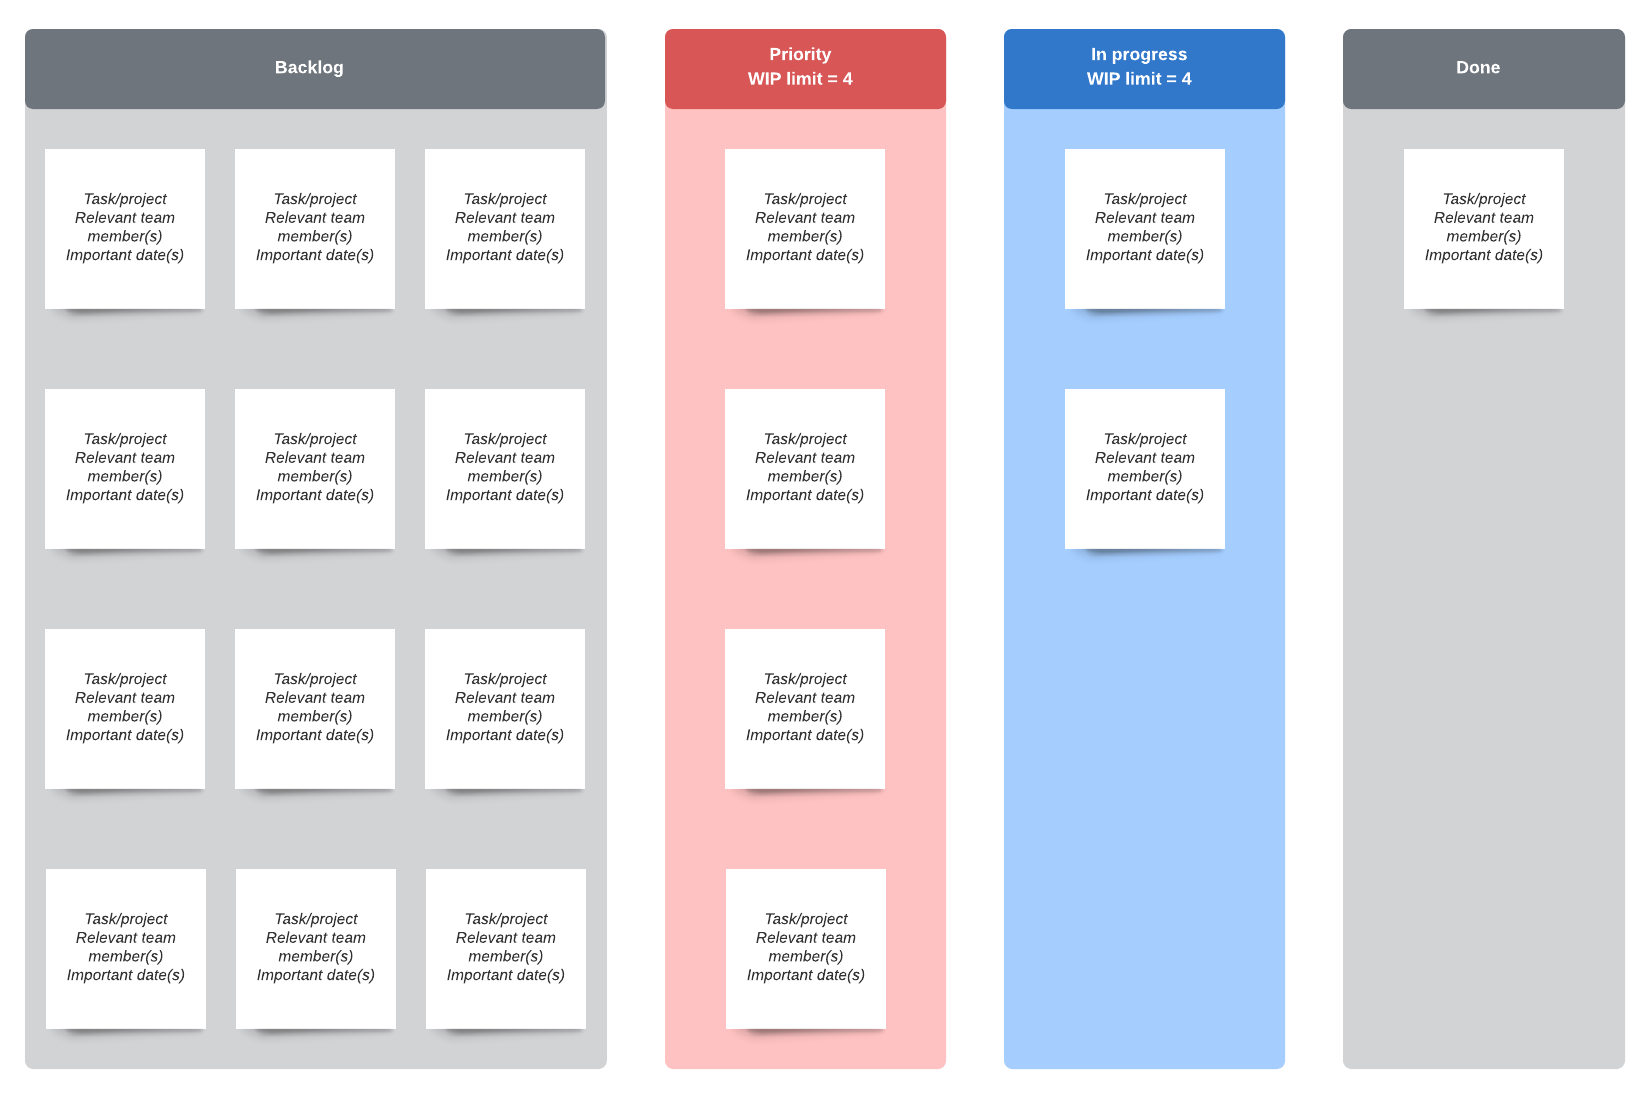
The Kanban board is an optimal solution for teams with a flexible workflow. Like Gantt charts, they allow you to track the progress of tasks from start to finish, but the visual simplicity of moving cards makes kanban boards easy to understand and effective for communicating with co-workers.
Kanban boards can be built physically or virtually. Virtual boards are optimal for teams that are separated geographically. In Lucidchart, you can even conduct your sprint planning together as multiple editors add cards to your board in real time. Change colors to convey additional information including project type.
4. Scrum board
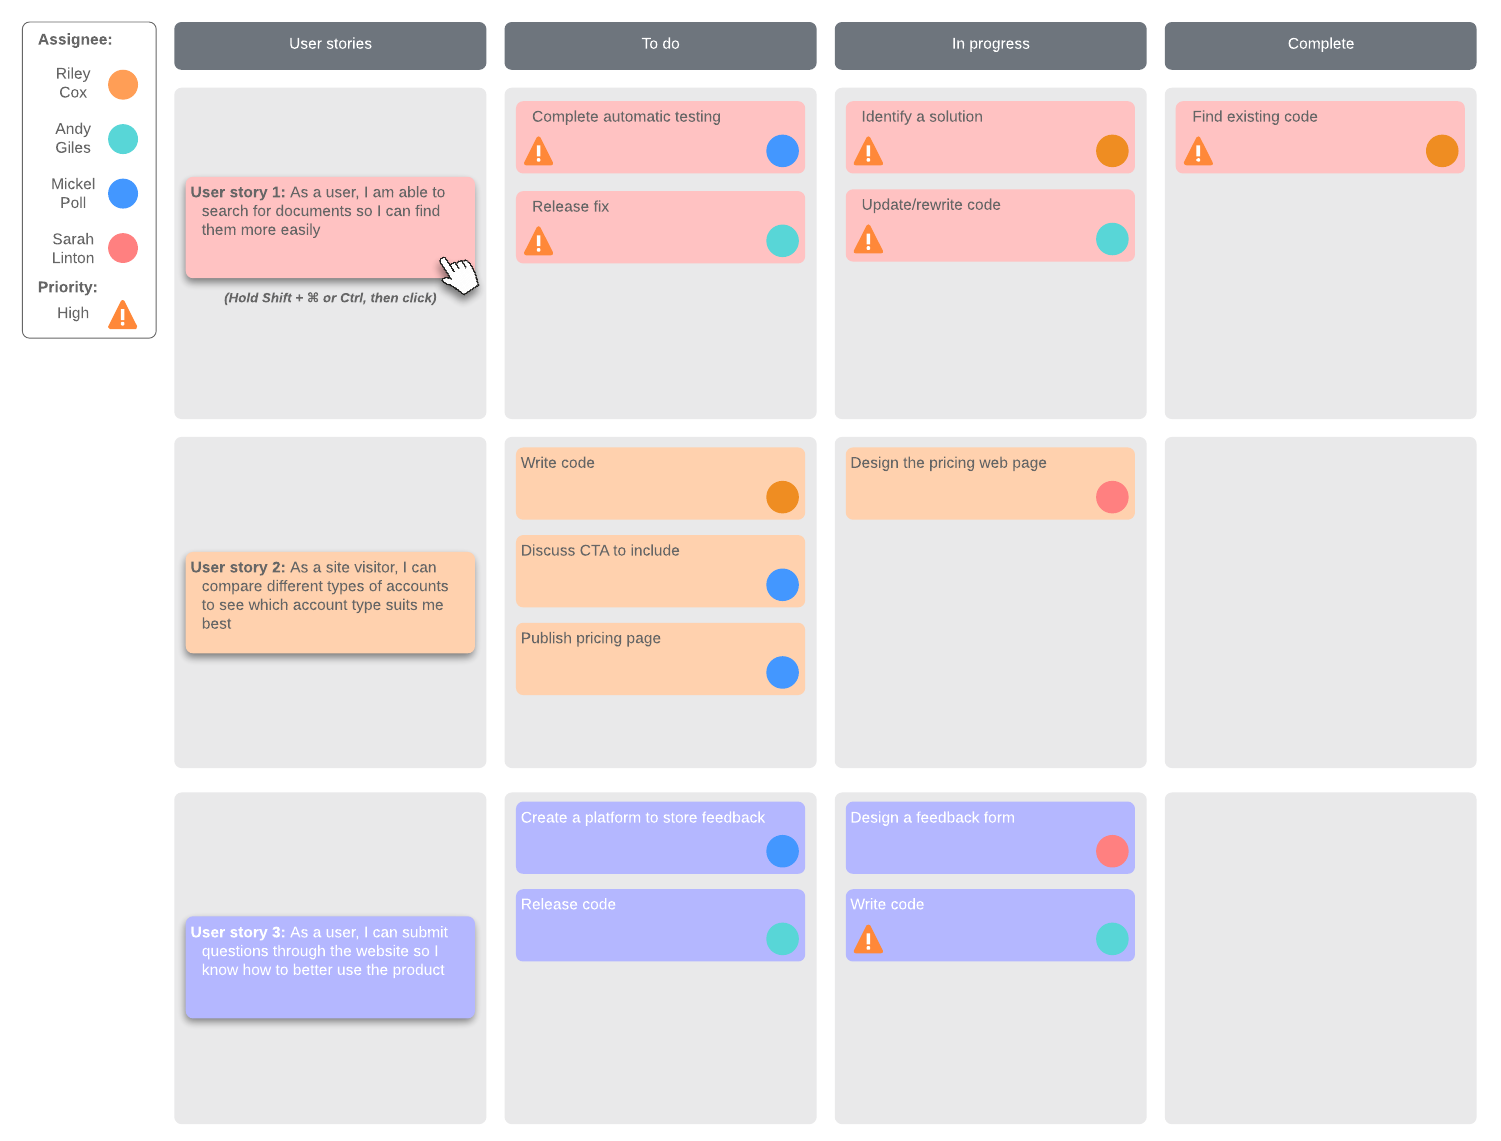
Similar to a Kanban board, a scrum board organizes projects chronologically by sprints. The format is very flexible and easily customized. Scrum boards are segmented into horizontal or vertical lanes used to track tasks that need to be completed in each sprint. The typical lanes included are "To Do," "In Progress," "In Test," and "Done." Add or remove tasks needed to adjust to the sprint timeline.
5. Cross-functional flowchart
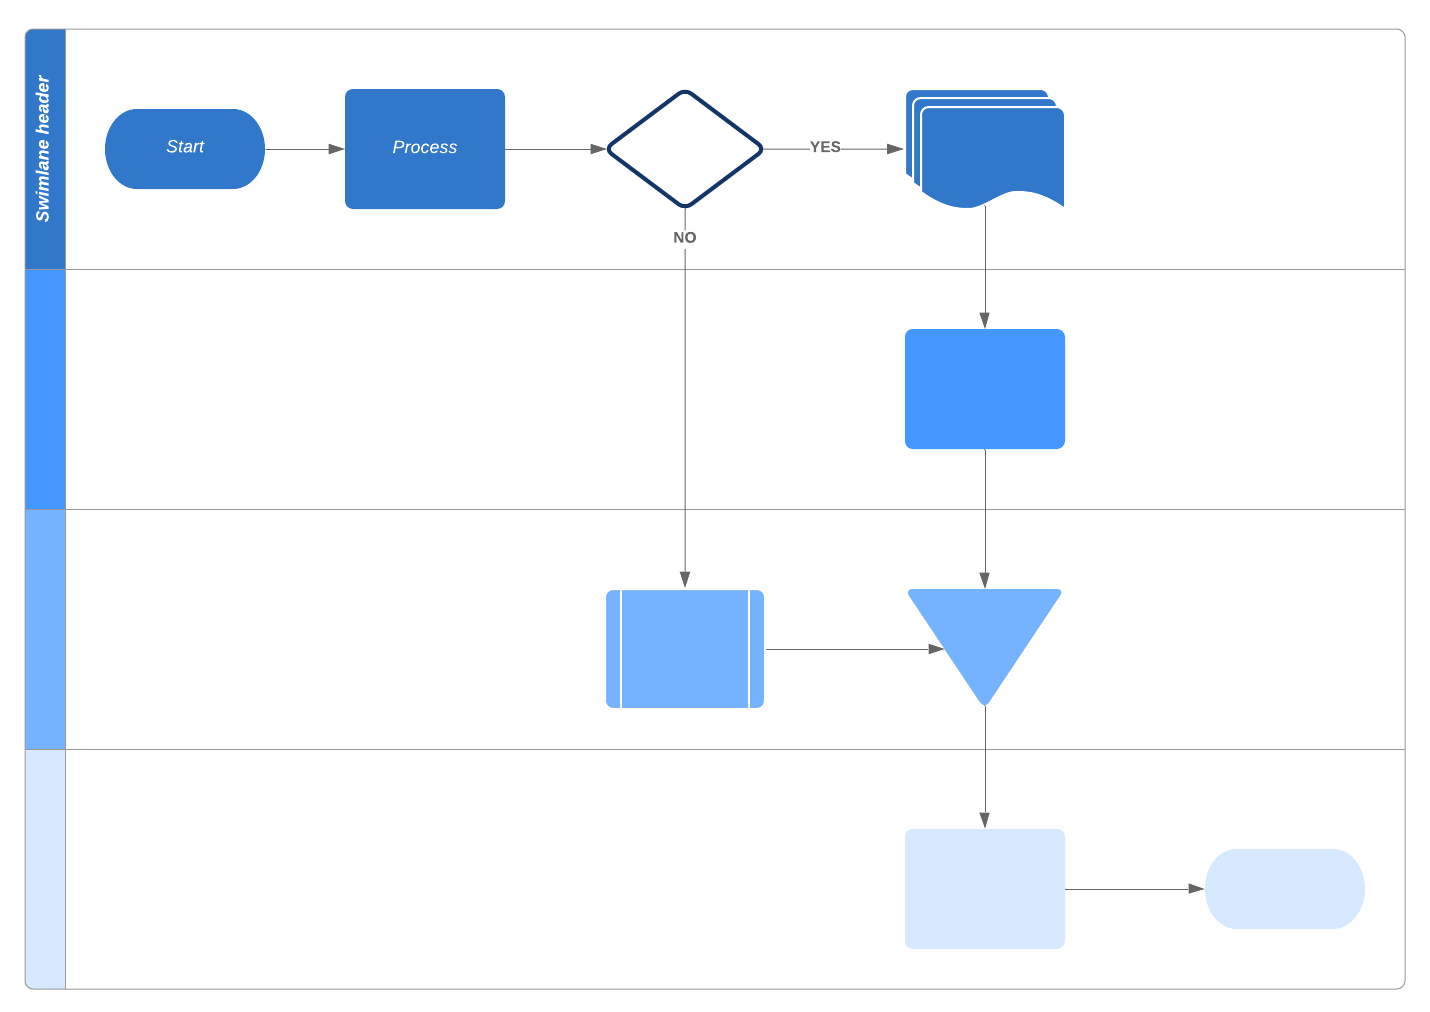
A cross-functional flowchart uses swimlanes to delineate responsibilities across different teams or groups. They track dependencies and transfers of information or products from one team to another. For this reason, they are a great Gantt chart alternative when you are working on a large project with multiple teams.
You can add detail to a cross-functional flowchart by layering horizontal and vertical swimlanes. One axis can show teams while the other represents time as in the example below. Once you have finished building your flowchart in Lucidchart, establish a single source of truth for your project by sharing it with all the teams and stakeholders involved. You can even control who is able to edit, comment, and view.
6. Checklist
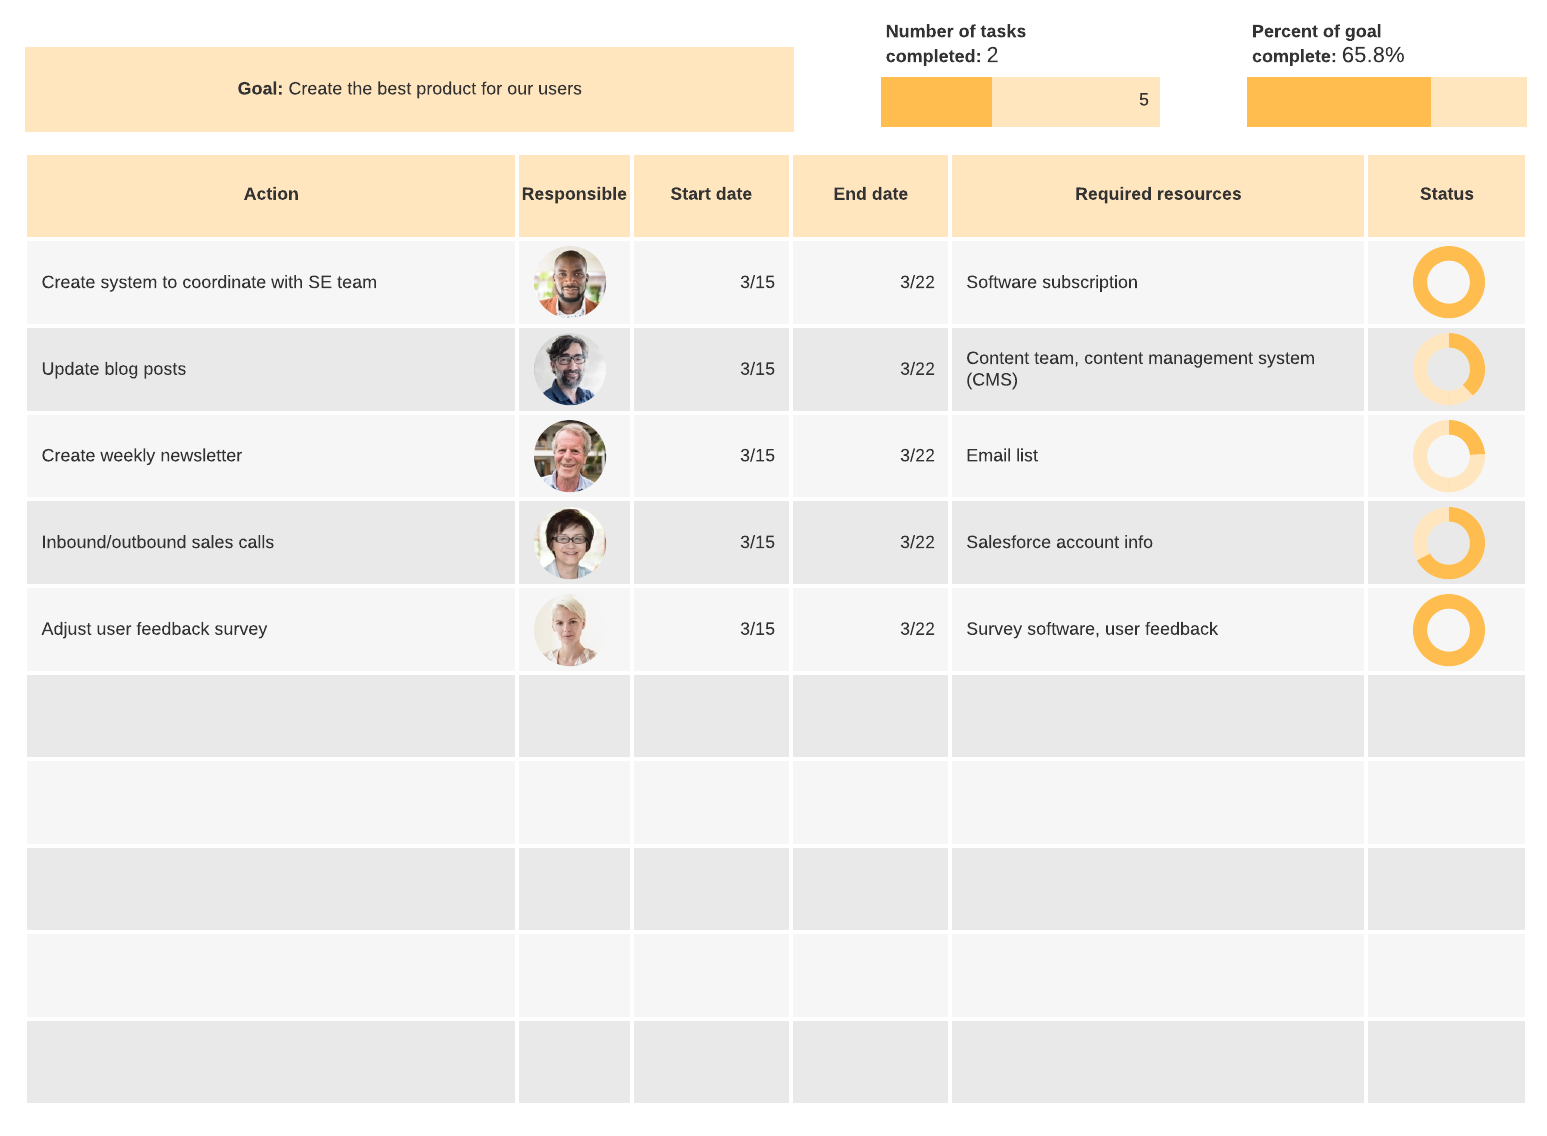
It doesn’t get more basic than a checklist. We’ve all used them to increase personal productivity at home or in the office. Why not give it a shot with your entire team? You could use a checklist by itself or attach one to a project network diagram to pair a high-view perspective with specific action items.
If you want to take your checklist up a notch, you can include dynamic shapes in Lucidchart to track how many tasks have been completed at a glance.
7. Simple Gantt chart
If your only hesitation with using a Gantt chart is its complexity, a simple Gantt chart may be your answer. Take a look at the modified version in Lucidchart.
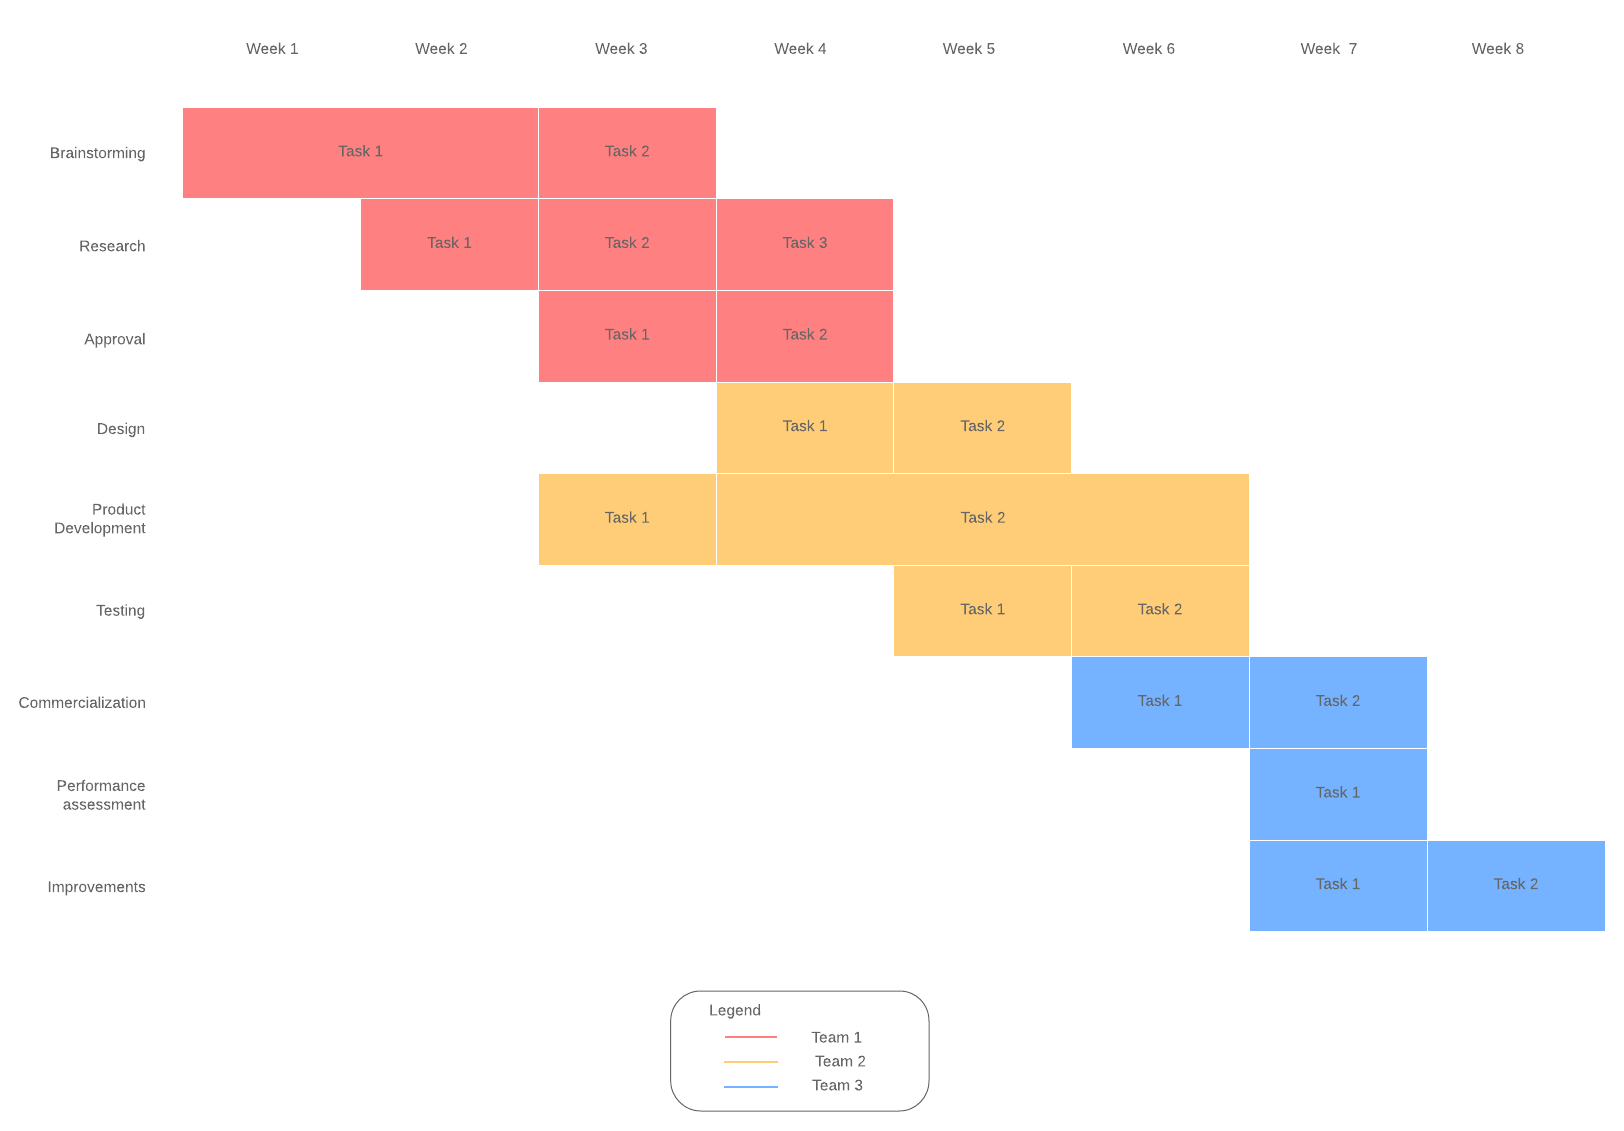
Gantt charts can be complicated to understand and difficult to maintain, and they may not help you communicate effectively with your team members or work with the flexibility you need. Try any of these Gantt chart alternatives by clicking the template above.

Visualize dependencies and keep projects on track when you sign up for Lucidchart.
Register nowAbout Lucidchart
Lucidchart, a cloud-based intelligent diagramming application, is a core component of Lucid Software's Visual Collaboration Suite. This intuitive, cloud-based solution empowers teams to collaborate in real-time to build flowcharts, mockups, UML diagrams, customer journey maps, and more. Lucidchart propels teams forward to build the future faster. Lucid is proud to serve top businesses around the world, including customers such as Google, GE, and NBC Universal, and 99% of the Fortune 500. Lucid partners with industry leaders, including Google, Atlassian, and Microsoft. Since its founding, Lucid has received numerous awards for its products, business, and workplace culture. For more information, visit lucidchart.com.
Related articles
How to Make a Gantt Chart in Excel
Learn two approaches on how to make a Gantt chart in Excel with this complete step-by-step guide. Free templates included!
Advantages of PERT charts vs. Gantt charts
What's the difference between a PERT chart and a Gantt chart? Both of these tools can improve your project management processes. Learn when to use PERT and Gantt charts and how to create them.

