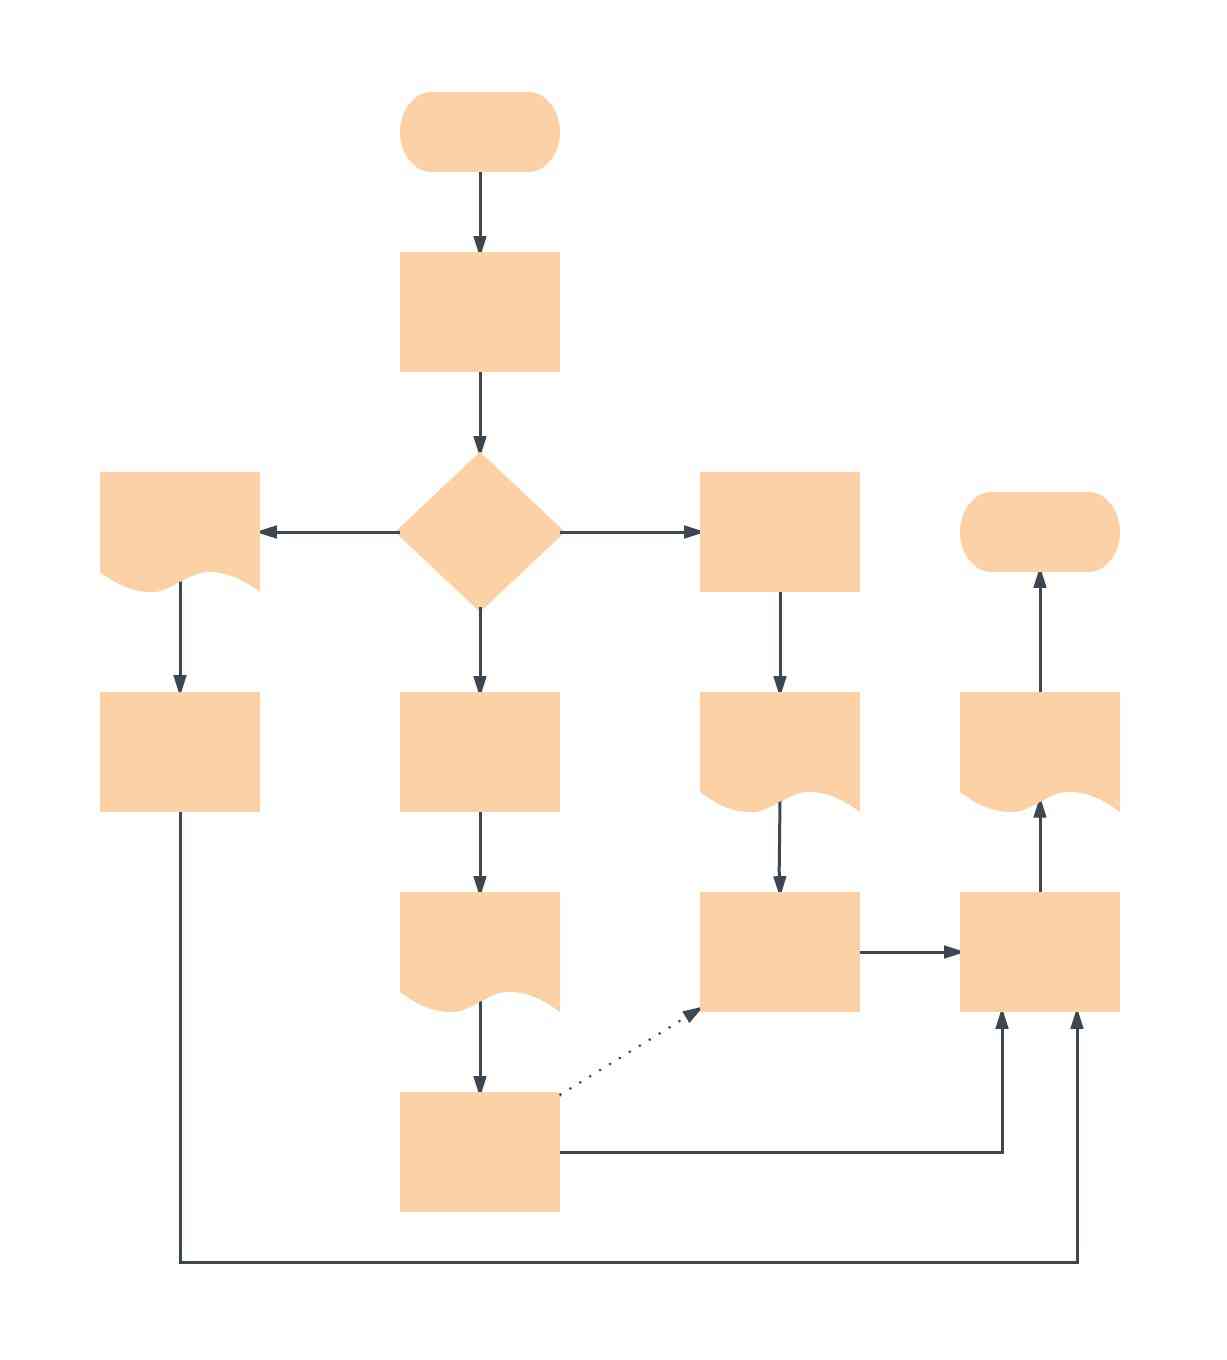
This comprehensive guide offers everything you need to know about flowcharts, including definitions, use cases, symbols, tips, and how to use our flowchart tool to get started.
9 minute read
Want to create a flowchart of your own? Try Lucidchart. It's fast, easy, and totally free.
What is a flowchart?
A flowchart is a diagram that depicts a process, system or computer algorithm. They are widely used in multiple fields to document, study, plan, improve and communicate often complex processes in clear, easy-to-understand diagrams. Flowcharts, sometimes spelled as flow charts, use rectangles, ovals, diamonds and potentially numerous other shapes to define the type of step, along with connecting arrows to define flow and sequence. They can range from simple, hand-drawn charts to comprehensive computer-drawn diagrams depicting multiple steps and routes. If we consider all the various forms of flowcharts, they are one of the most common diagrams on the planet, used by both technical and non-technical people in numerous fields. Flowcharts are sometimes called by more specialized names such as Process Flowchart, Process Map, Functional Flowchart, Business Process Mapping, Business Process Modeling and Notation (BPMN), or Process Flow Diagram (PFD). They are related to other popular diagrams, such as Data Flow Diagrams (DFDs) and Unified Modeling Language (UML) Activity Diagrams.


Common flowchart symbols and notations
Don’t be intimidated by the wide array of flowchart shapes. Each symbol has a specific meaning and context where its use is appropriate. If you get confused while drawing your flow chart, remember that most charts can be drawn with just a few common symbols, which are listed below.
These flowchart shapes and symbols are some of the most common types you'll find in most flowchart diagrams.
| Flowchart Symbol | Name | Description |
|---|---|---|
 | Process symbol |
Also known as an “Action Symbol,” this shape represents a process, action, or function. It’s the most widely-used symbol in flowcharting. |
 | Start/End symbol |
Also known as the “Terminator Symbol,” this symbol represents the start points, end points, and potential outcomes of a path. Often contains “Start” or “End” within the shape. |
 | Document symbol |
Represents the input or output of a document, specifically. Examples of and input are receiving a report, email, or order. Examples of an output using a document symbol include generating a presentation, memo, or letter. |
 | Decision symbol |
Indicates a question to be answered — usually yes/no or true/false. The flowchart path may then split off into different branches depending on the answer or consequences thereafter. |
 | Connector symbol |
Usually used within more complex charts, this symbol connects separate elements across one page. |
 | Off-Page Connector/Link symbol |
Frequently used within complex charts, this symbol connects separate elements across multiple pages with the page number usually placed on or within the shape for easy reference. |
 | Input/Output symbol |
Also referred to as the “Data Symbol,” this shape represents data that is available for input or output as well as representing resources used or generated. While the paper tape symbol also represents input/output, it is outdated and no longer in common use for flowchart diagramming. |
 | Comment/Note symbol |
Placed along with context, this symbol adds needed explanation or comments within the specified range. It may be connected by a dashed line to the relevant section of the flowchart as well. |
Advanced flowchart symbols
Many of these additional flowchart symbols are best utilized when mapping out a process flow diagram for apps, user flow, data processing, etc.
| Flowchart Symbol | Name | Description |
|---|---|---|
 | Database symbol |
Represents data housed on a storage service that will likely allow for searching and filtering by users. |
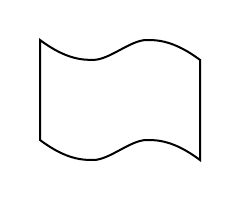 | Paper tape symbol |
An outdated symbol rarely ever used in modern practices or process flows, but this shape could be used if you’re mapping out processes or input methods on much older computers and CNC machines. |
 | Summing junction symbol |
Sums the input of several converging paths. |
 | Predefined process symbol |
Indicates a complicated process or operation that is well-known or defined elsewhere. |
 | Internal storage symbol |
Commonly used to map out software designs, this shape indicates data that is stored within internal memory. |
 | Manual input symbol |
Represents the manual input of data into a field or step in a process, usually through a keyboard or device. Example scenario includes the step in a login process where a user is prompted to enter data manually. |
 | Manual operation symbol |
Indicates a step that must be done manually, not automatically. |
 | Merge symbol |
Combines multiple paths to become one. |
 | Multiple documents symbol |
Represents multiple documents or reports. |
 | Preparation symbol |
Differentiates between steps that prepare for work and steps that actually do work. It helps introduce the setup to another step within the same process. |
 | Stored data symbol |
Also known as “Data Storage” symbol, this shape represents where data gets stored within a process. |
 | Delay symbol |
Represents a segment of delay in a process. It can be helpful to indicate the exact length of delay within the shape. |
 | Or symbol |
Just as described, this shape indicates that the process flow continues two paths or more. |
 | Display symbol |
This shape is useful to indicate where information will get displayed within a process flow. |
 | Hard disk symbol |
Indicates where data is stored within a hard drive, also known as direct access storage. |
Want to create a flowchart of your own? Try Lucidchart. It's fast, easy, and totally free.
Create a flowchartHow to make a flowchart
Before you begin, you’ll want to set up an account with Lucidchart. It’s free for all first-time users. Once you’re signed up and have an account, no matter where you are on the Lucichart.com website, you can access the editor and your documents by clicking on the Log In button in the upper right corner which will then display as Documents when you’re actually logged in.
1. Once you’re in the Lucidchart editor, you can choose to start with an existing flowchart template from our template library that you can then proceed to customize or you can start with a blank canvas and make a flowchart from scratch.
2. Click on any shape, drag it onto the editor, and drop it in for placement. You can input whatever info you want including images, animations, and links.
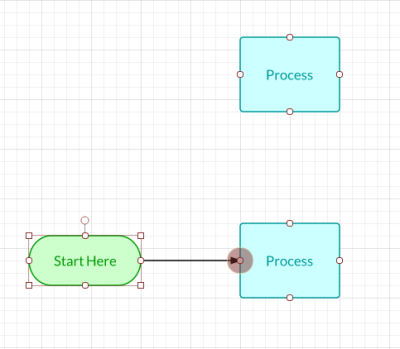
3. To connect shapes, click on the red outlined white dot on any shape and drag a line out to connect or point to your desired location or shape.
When you’re done making your flowchart, you can share it with anyone and customize the settings by clicking the Share button in the upper right corner. You can also publish it in any format when you go to File > Download As or File > Publish. Try it out and see what works best for your collaboration and publishing needs.
How to format your flowchart
Edit Shapes
You can customize each and every shape one by one or as a group in Lucidchart. To edit a single shape, click on it and enhance or reduce it to the desired size. Change the color by selecting a shade from the Fill Color icon in the top toolbar or select a pre-made Theme from the right menu. That top toolbar features tools that will allow the option to edit nearly every aspect of your shapes, lines, and text.
Edit Lines
Select any line you’d like to customize and then make your way over to the top toolbar to customize the thickness, line style, even arrow style for your lines.
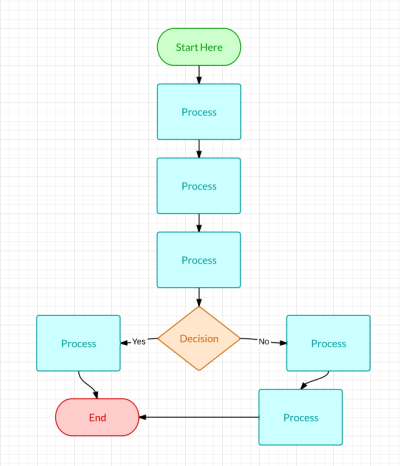
You can select a single item on your canvas and edit it, but if you click to hold and then select a section or area, you’ll find that you’ve highlighted all the objects within that area and whatever movements or customizations you choose will apply to all the items in that highlighted section.
Mistakes might happen when you’re making your flowchart, but you won’t have to do much reformatting or start all over if things start to get messy. If you ever need to undo your last action, a simple Ctrl+Z shortcut will work. You can also view the entire revision history in the right sidebar under History and restore your current diagram to any previous revision you select.
Add your flowchart to your favorite apps
Now that you know how to make a flowchart and customize it to your liking, it’s important to know that Lucidchart is integrated with all of the popular business, education, and marketing platforms out there from Google to Atlassian to Amazon Web Services. It’s easy to publish and embed your final flowchart or diagram to any of these applications and blow your audience away, giving them a visual, more efficient way to view your shared information.
Flowchart Templates and Examples
Blank flowchart template
Flowcharts allow anyone—from sales representatives to developers to creatives—to better visualize any processes, projects, and thoughts and present them in a meaningful way. Start with this blank flowchart template and customize it based on your needs.
Decision flowchart template
For those hard-to-make decisions, map out potential consequences and scenarios with this decision flowchart template. Visualize all the different outcomes to any situation and make your choice clear.
Website flowchart template
Creating a website takes serious planning and organization. Use this website flowchart template as you start mapping out the layout of your website. You can better visualize the structure and page depths of your entire site, giving you a clear idea of how you want your visitors to explore your website and what content you'll need to create.
Communication flowchart template
To encourage effective communication, you want to make sure that people understand who should be involved, what that person's role is, and what happens next. This example flowchart shows the different outlets of communication between various entities in a hypothetical public health crisis. You can use this template and customize it to your own scenario.
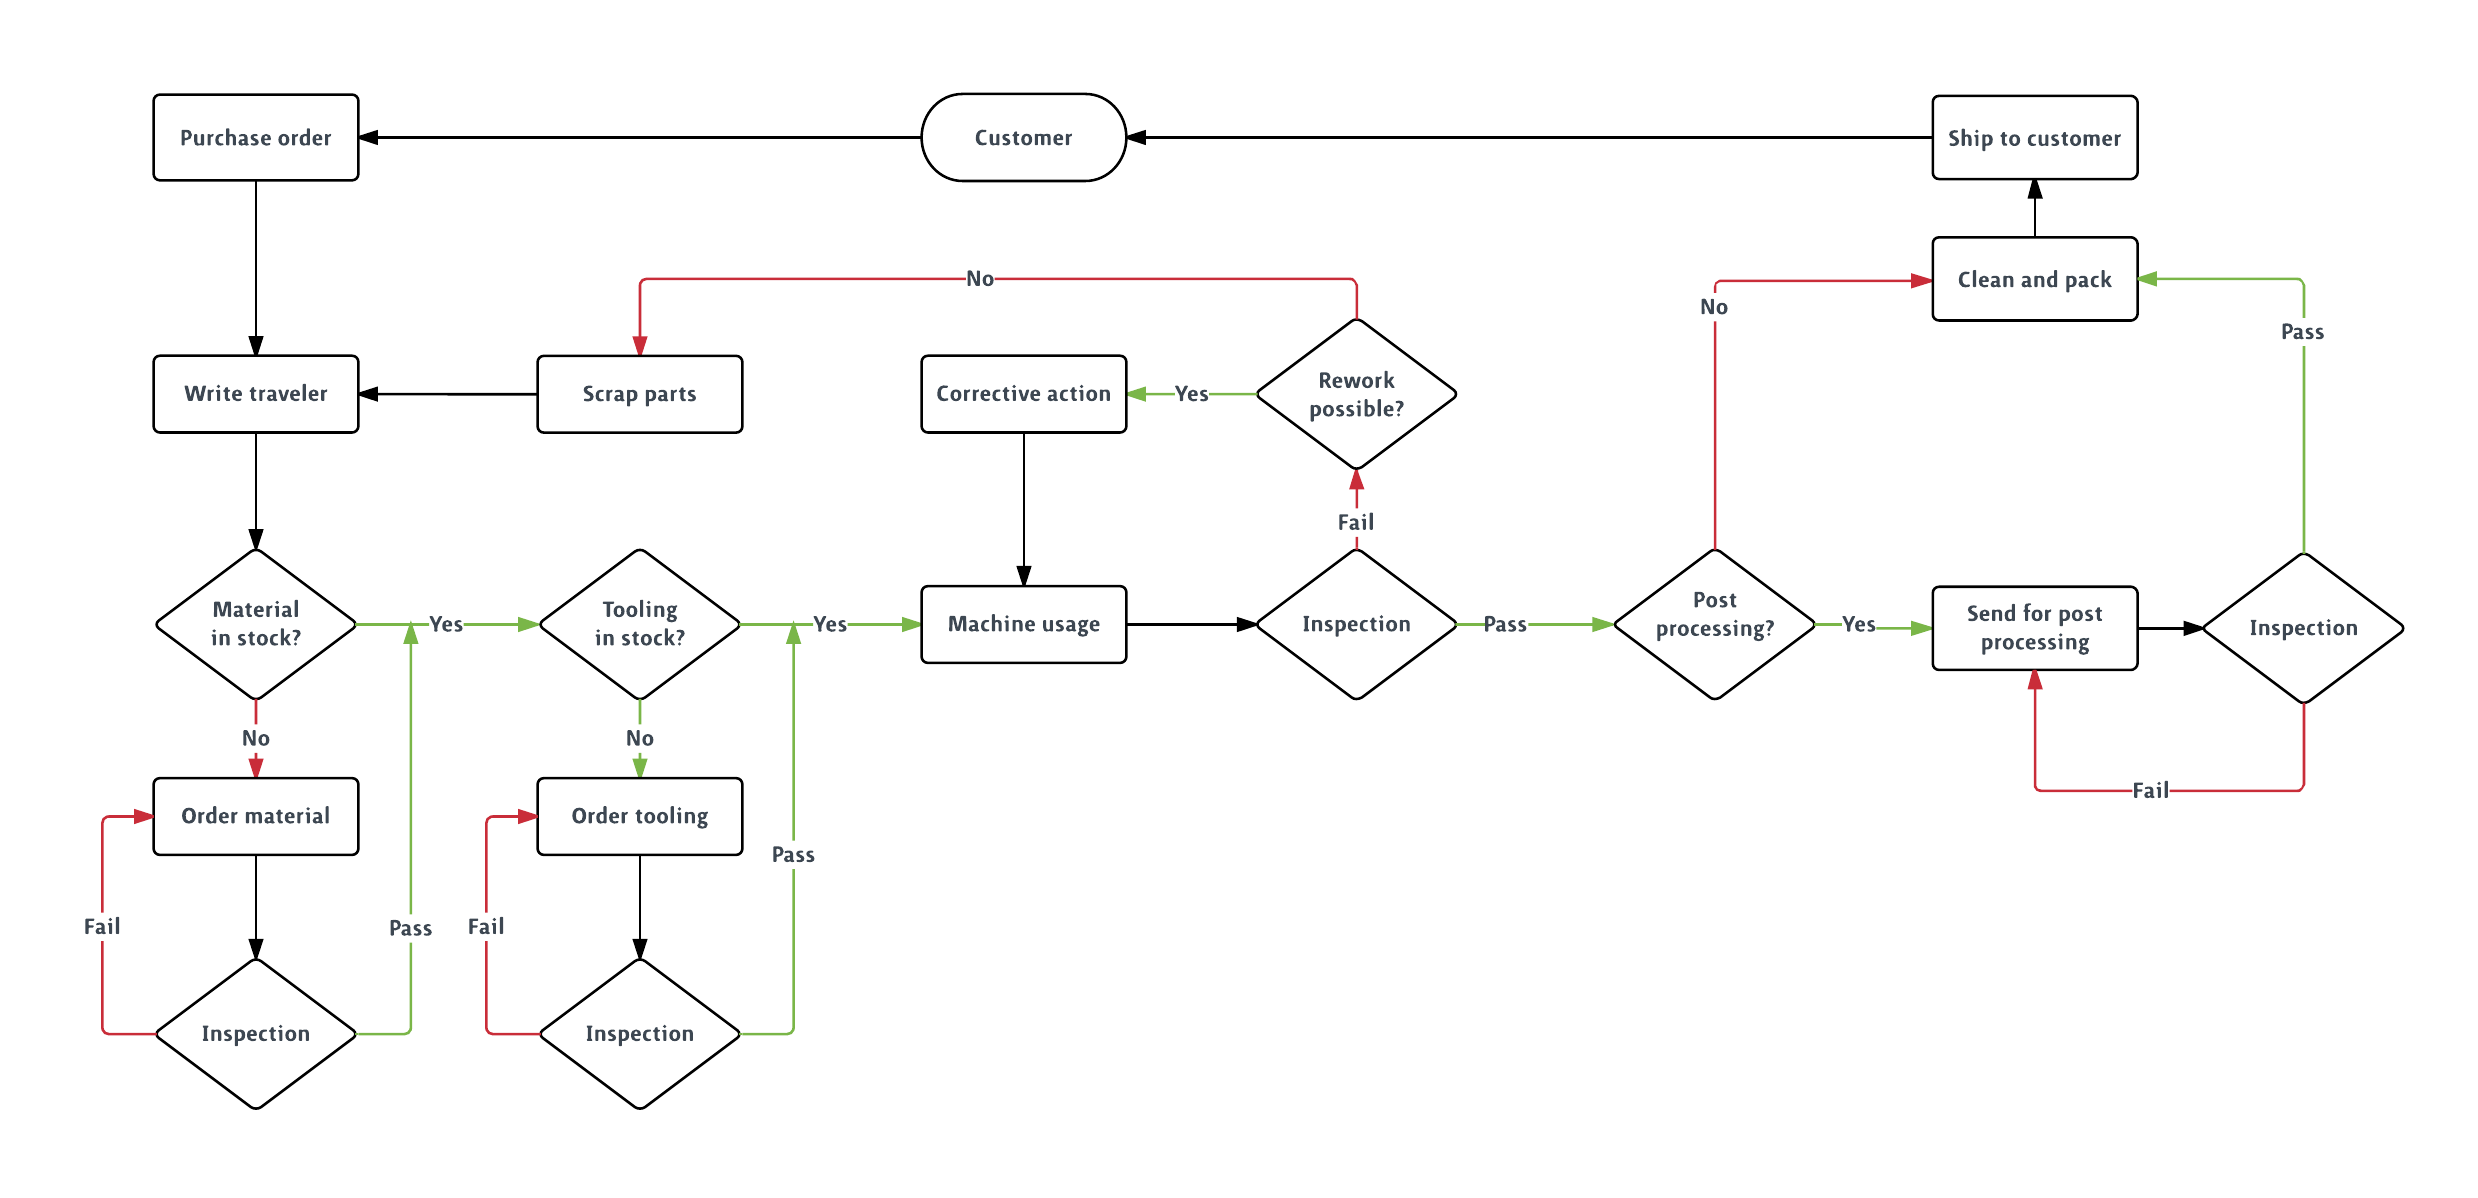
Production flowchart template
Manufacturers might find this generic production flowchart template to be a good starting point to draw out their own processes or projects. Find ways to make your current process more efficient and maximize your time as you customize this example template.
System flowchart template
System flowcharts display the flow of data through a specific system and all the different options available depending on the direction of flow. For example, this system flowchart template shows the path for a new user logging into an online service. Customize this system flowchart template to draw out your user flow and create the best user experience.
Programming flowchart template
Programming can be complex, but with a flowchart, you can make even the most intricate systems easy to understand for those who might be less familiar with programming. Customize this programming flowchart template, which currently shows the capabilities that a programmer will need to code.
