Learn the essentials of ER Diagrams and ER Models, along with their origins, uses, examples, components, limitations and guidelines on how to draw them using our ER diagram tool.
11 minute read
Want to make a Diagram of your own? Try Lucidchart. It's quick, easy, and completely free.
What is an ER diagram?
An Entity Relationship (ER) Diagram is a type of flowchart that illustrates how “entities” such as people, objects or concepts relate to each other within a system. ER Diagrams are most often used to design or debug relational databases in the fields of software engineering, business information systems, education and research. Also known as ERDs or ER Models, they use a defined set of symbols such as rectangles, diamonds, ovals and connecting lines to depict the interconnectedness of entities, relationships and their attributes. They mirror grammatical structure, with entities as nouns and relationships as verbs.

ER diagrams are related to data structure diagrams (DSDs), which focus on the relationships of elements within entities instead of relationships between entities themselves. ER diagrams also are often used in conjunction with data flow diagrams (DFDs), which map out the flow of information for processes or systems.

ER models and data models are typically drawn at up to three levels of detail:
Conceptual data model:
The highest-level view containing the least detail. Its value is showing overall scope of the model and portraying the system architecture. For a system of smaller scope, it may not be necessary to draw. Instead, start with the logical model.Logical data model:
Contains more detail than a conceptual model. More detailed operational and transactional entities are now defined. The logical model is independent of the technology in which it will be implemented.Physical data model:
One or more physical model may be developed from each logical model. The physical models must show enough technology detail to produce and implement the actual database.
Note that similar detail and scope levels exist in other types of diagrams, such as data flow diagrams, but that it contrasts with software engineering’s three schema approach, which divides the information a bit differently. Sometimes, engineers will branch out ER diagrams with additional hierarchies to add necessary information levels for database design. For example, they may add groupings by extend up with superclasses and down with subclasses.
Only for relational data:
Understand that the purpose is to show relationships. ER diagrams show only that relational structure.Not for unstructured data:
Unless the data is cleanly delineated into different fields, rows or columns, ER diagrams are probably of limited use. The same is true of semi-structured data, because only some of the data will be useful.Difficulty integrating with an existing database:
Using ER Models to integrate with an existing database can be a challenge because of the different architectures.
Uses of entity relationship diagrams
Database design:
ER diagrams are used to model and design relational databases, in terms of logic and business rules (in a logical data model) and in terms of the specific technology to be implemented (in a physical data model.) In software engineering, an ER diagram is often an initial step in determining requirements for an information systems project. It’s also later used to model a particular database or databases. A relational database has an equivalent relational table and can potentially be expressed that way as needed.Database troubleshooting:
ER diagrams are used to analyze existing databases to find and resolve problems in logic or deployment. Drawing the diagram should reveal where it’s going wrong.Business information systems:
The diagrams are used to design or analyze relational databases used in business processes. Any business process that uses fielded data involving entities, actions and interplay can potentially benefit from a relational database. It can streamline processes, uncover information more easily and improve results.Business process re-engineering (BPR):
ER diagrams help in analyzing databases used in business process re-engineering and in modeling a new database setup.Education:
Databases are today’s method of storing relational information for educational purposes and later retrieval, so ER Diagrams can be valuable in planning those data structures.Research:
Since so much research focuses on structured data, ER diagrams can play a key role in setting up useful databases to analyze the data.
ERD symbols and notations
Entity-relationship diagrams (ERD) are essential to modeling anything from simple to complex databases, but the shapes and notations used can be very confusing. This guide will help you to become an expert in ER diagram notation, and you will be well on your way to model your own database!
Conceptual Data Models establish a broad view of what should be included in the model set. Conceptual ERDs can be used as the foundation for logical data models. They may also be used to form commonality relationships between ER models as a basis for data model integration. All of the symbols shown below are found in the UML Entity Relationship and Entity Relationship shape library of Lucidchart.
ERD entity symbols
Entities are objects or concepts that represent important data. Entities are typically nouns such as product, customer, location, or promotion. There are three types of entities commonly used in entity relationship diagrams.
| Entity Symbol | Name | Description |
|---|---|---|
 | Strong entity |
These shapes are independent from other entities, and are often called parent entities, since they will often have weak entities that depend on them. They will also have a primary key, distinguishing each occurrence of the entity. |
 | Weak entity |
Weak entities depend on some other entity type. They don't have primary keys, and have no meaning in the diagram without their parent entity. |
 | Associative entity | Associative entities relate the instances of several entity types. They also contain attributes specific to the relationship between those entity instances. |
ERD relationship symbols
Within entity-relationship diagrams, relationships are used to document the interaction between two entities. Relationships are usually verbs such as assign, associate, or track and provide useful information that could not be discerned with just the entity types.
| Relationship Symbol | Name | Description |
|---|---|---|
 | Relationship |
Relationships are associations between or among entities. |
 | Weak relationship |
Weak Relationships are connections between a weak entity and its owner. |
ERD attribute symbols
ERD attributes are characteristics of the entity that help users to better understand the database. Attributes are included to include details of the various entities that are highlighted in a conceptual ER diagram.
| Attribute Symbol | Name | Description |
|---|---|---|
 | Attribute |
Attributes are characteristics of an entity, a many-to-many relationship, or a one-to-one relationship. |
 | Multivalued attribute |
Multivalued attributes are those that can take on more than one value. |
 | Derived attribute |
Derived attributes are attributes whose value can be calculated from related attribute values. |
 | Relationship |
Relationships are associations between or among entities. |
Physical ER diagram symbols
The physical data model is the most granular level of entity-relationship diagrams, and represents the process of adding information to the database. Physical ER models show all table structures, including column name, column data type, column constraints, primary key, foreign key, and relationships between tables.
As shown below, tables are another way of representing entities. The key parts of Entity-relationship Tables are:
Fields
Fields represent the portion of a table that establish the attributes of the entity. Attributes are typically thought of as columns in the database that the ERD models.

In the image above, InterestRate and LoanAmount are both attributes of the entity that are contained as fields.
Keys
Keys are one way to categorize attributes. ER diagrams help users to model their databases by using various tables that ensure that the database is organized, efficient, and fast. Keys are used to link various tables in a database to each other in the most efficient way possible.
Primary Keys
Primary keys are an attribute or combination of attributes that uniquely identifies one and only one instance of an entity.
Foreign Keys
Foreign keys are created any time an attribute relates to another entity in a one-to-one or one-to-many relationship.

Each car can only be financed by one bank, therefore the primary key BankId from the Bank table is used as the foreign key FinancedBy in the Car table. This BankID is able to be used as the foreign key for multiple cars.
Types
Types refer to the type of data in the corresponding field in a table. Types can also refer to entity types, which describe the composition of an entity; e.g., a book's entity types are author, title, and published date.

Diagramming is quick and easy with Lucidchart. Start a free trial today to start creating and collaborating.
Make a diagramER diagram notation
While crow's foot notation is often recognized as the most intuitive style, some use OMT, IDEF, Bachman, or UML notation, according to their preferences. Crow's foot notation, however, has an intuitive graphic format, making it the preferred ERD notation for Lucidchart.
Cardinality and ordinality
Cardinality refers to the maximum number of times an instance in one entity can relate to instances of another entity. Ordinality, on the other hand, is the minimum number of times an instance in one entity can be associated with an instance in the related entity.
Cardinality and ordinality are shown by the styling of a line and its endpoint, according to the chosen notation style.

How to create a basic ER diagram
Entity-relationship diagrams are incredibly useful, and you can easily create one of your own by following these simple steps.
1. Determine the entities: Entities are typically nouns such as car, bank, student, or product.
In an ER Diagram, entities are the most important parts. To proceed, we will be creating a conceptual ER diagram of a simple system in which a student registers for a course that is taught by a professor. Check out this awesome tutorials to review ER Diagram Shapes. In this example, the three entities are “Student,” “Course,” and “Professor.”

2. Identify the relationships: Relationships highlight how entities interact with each other.
Relationships are typically verbs such as “buys,” “contains,” or “does.” In our example, the relationships “Registers for” and “Teaches” effectively explain the interactions between the three entities.

3. Add attributes: Attributes show specific characteristics of an entity, refining what information is important to the model.

4. Complete the diagram
Organizing the ERD in a logical way is incredibly important to increase comprehension. The main purpose of entity-relationship diagrams is to model a complex database, so learning how to create simple, logical ERDs is key.
How to create an ER Diagram in Lucidchart
Lucidchart is a free tool that will allow you to diagram your database online and it's free when you register. Sign up is simple and you can start diagramming your databases immediately!
Enable ERD shape libraries
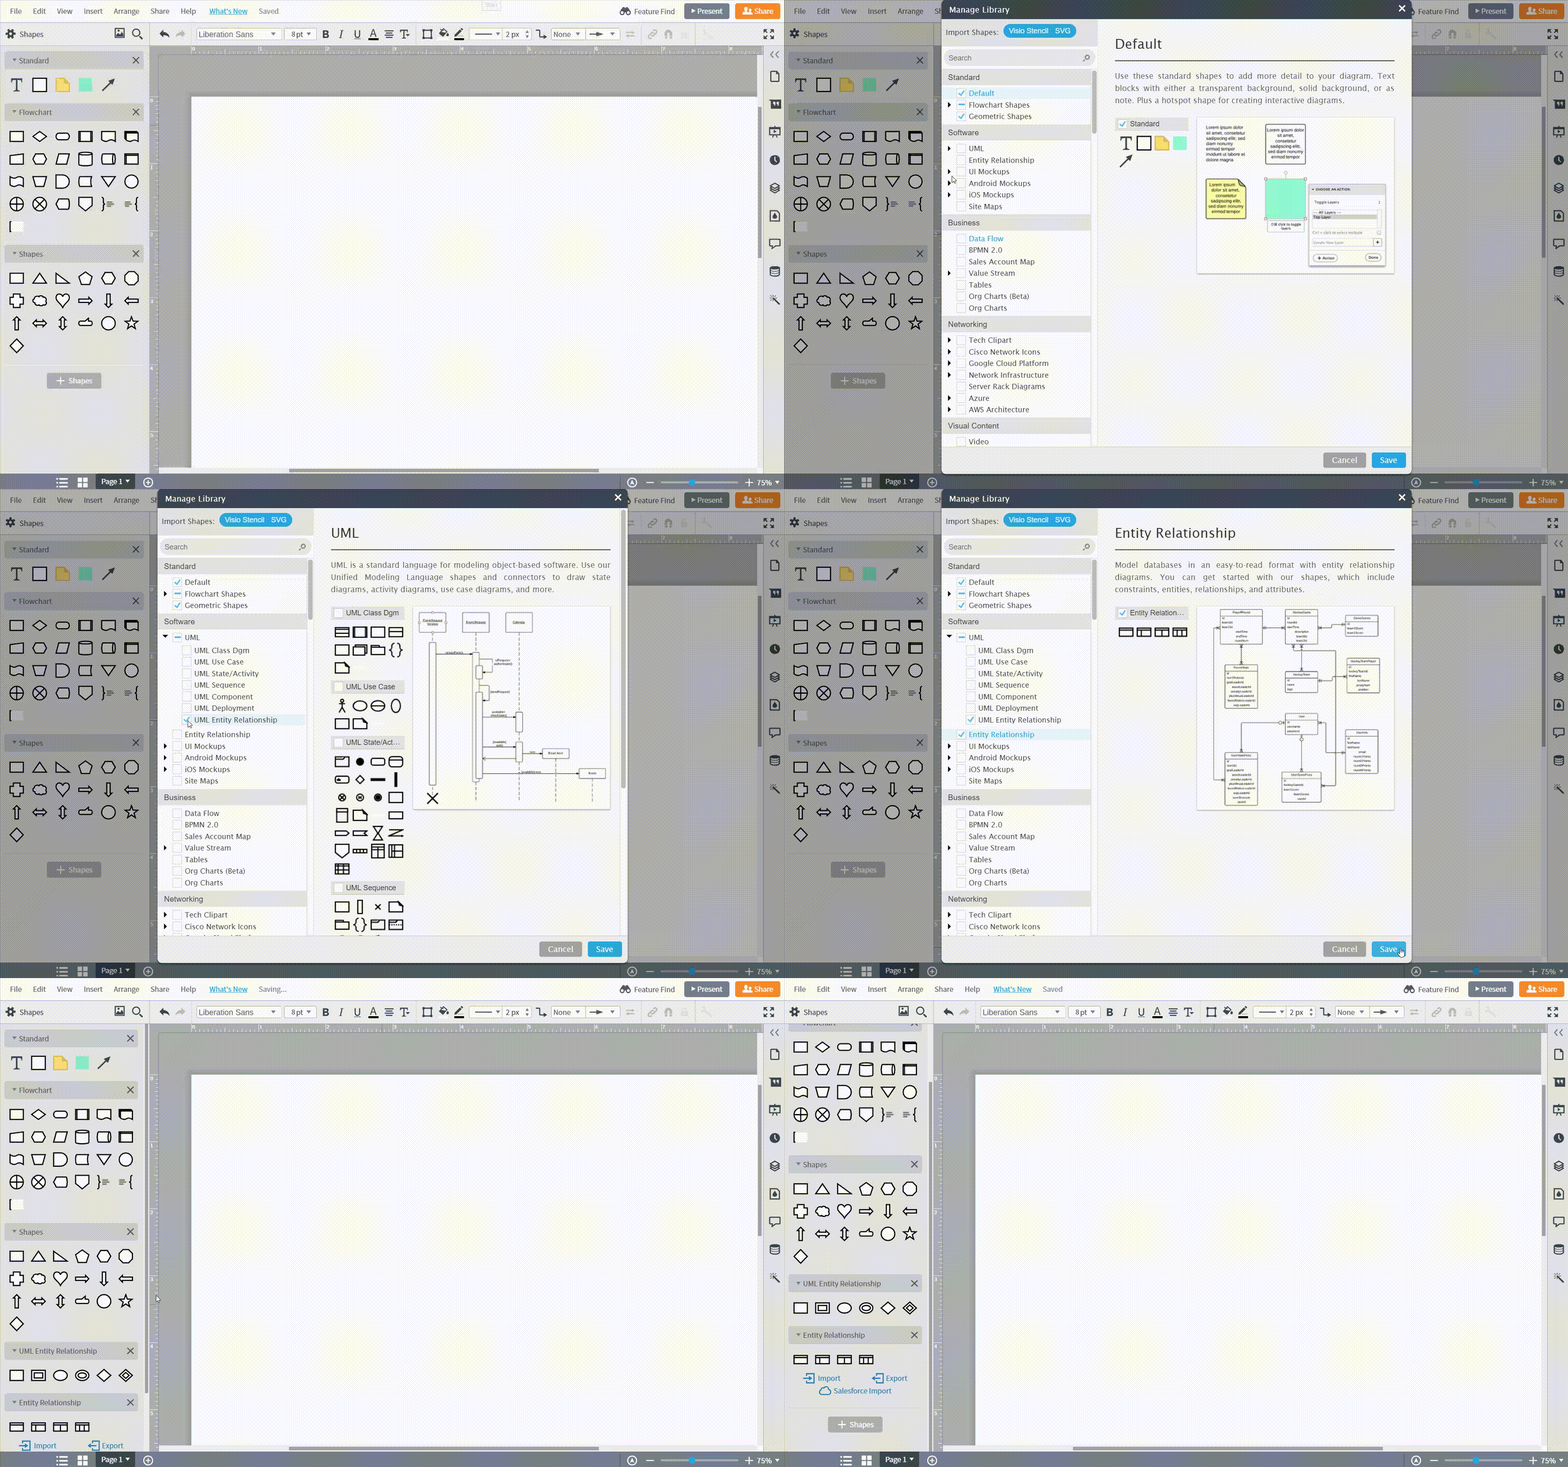
In a new document, make sure that the entity-relationship shapes libraries are enabled by clicking on the “+ Shapes” button found in the left menu.

Drag and drop shapes
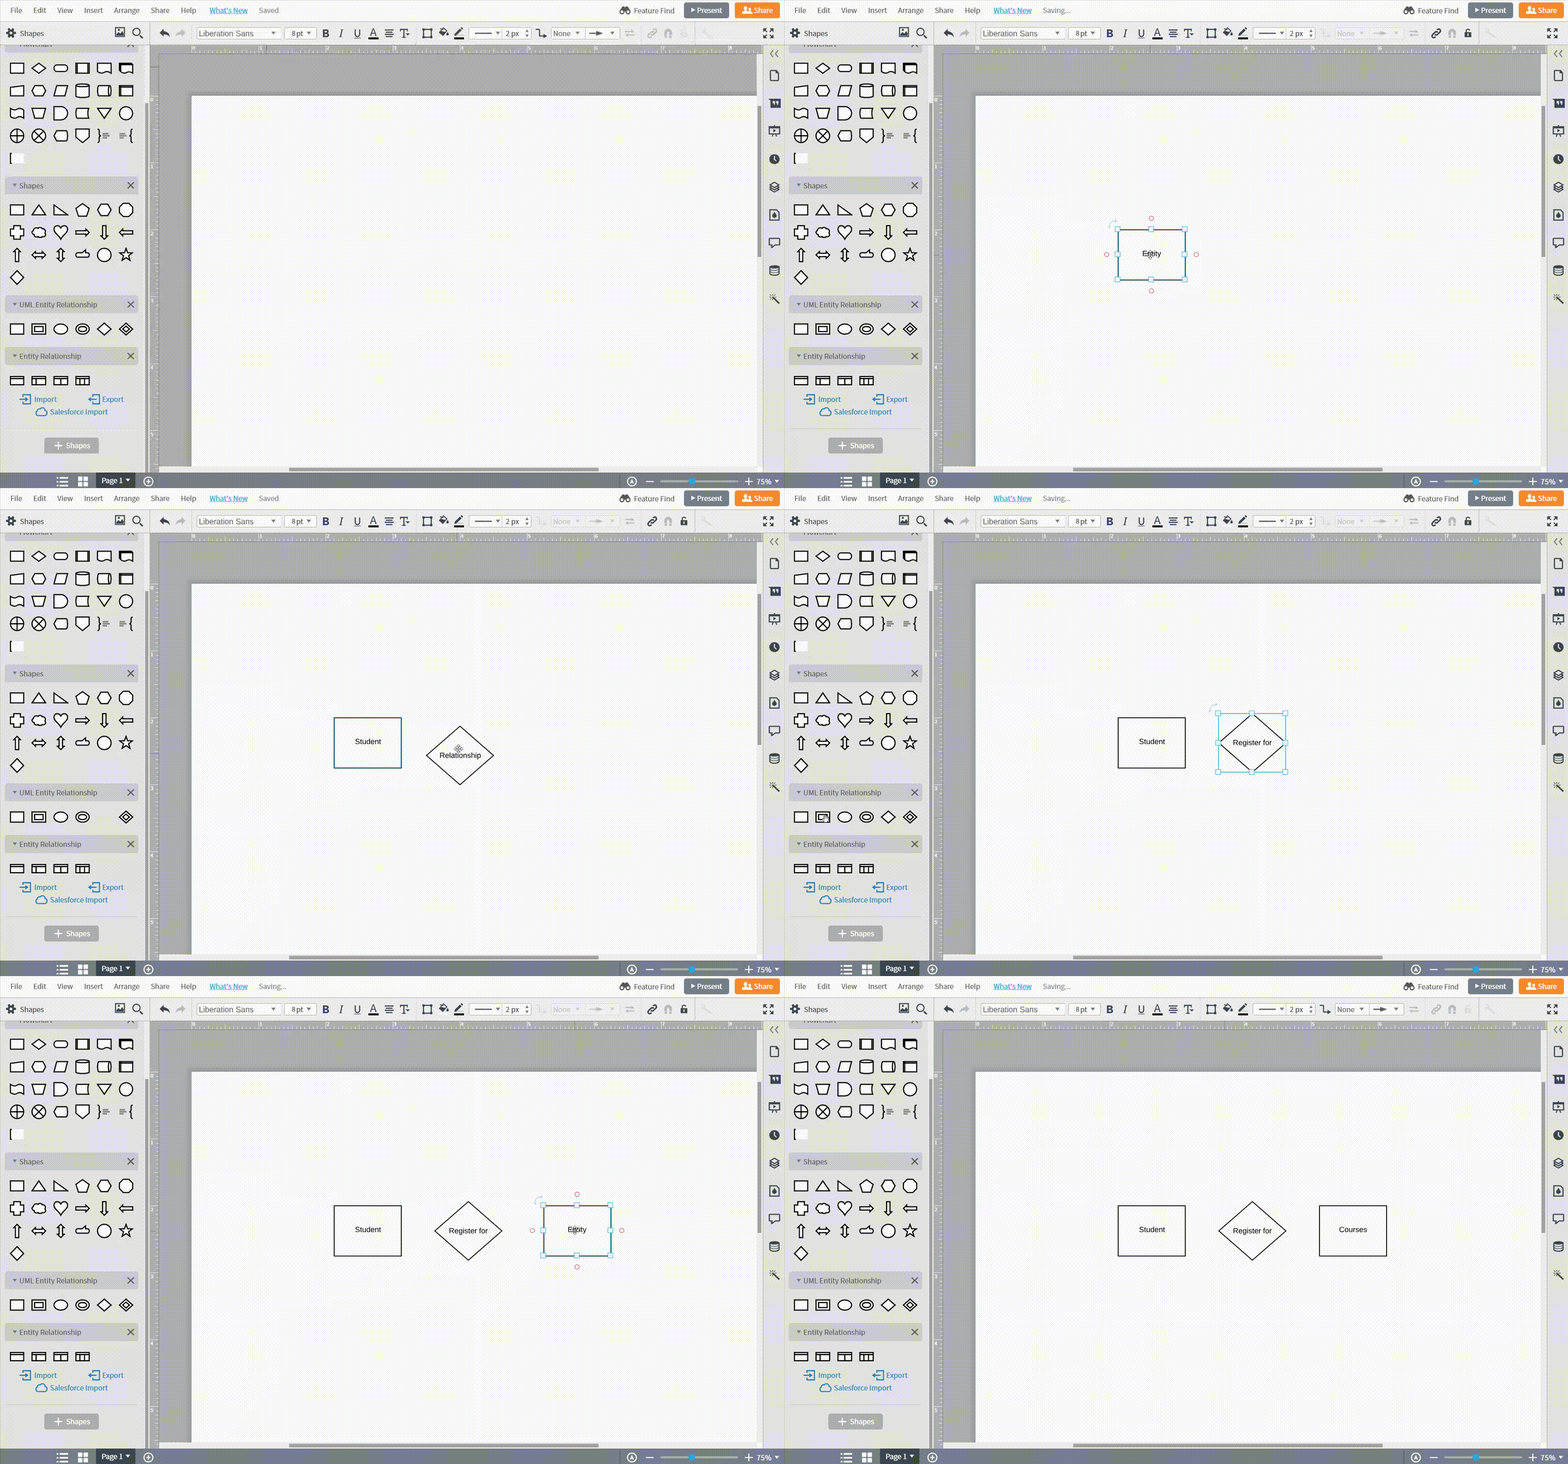
Once you have enabled the entity relationship shapes, add shapes to the canvas by clicking on the desired shape, and dropping it wherever you want it.

Connect shapes
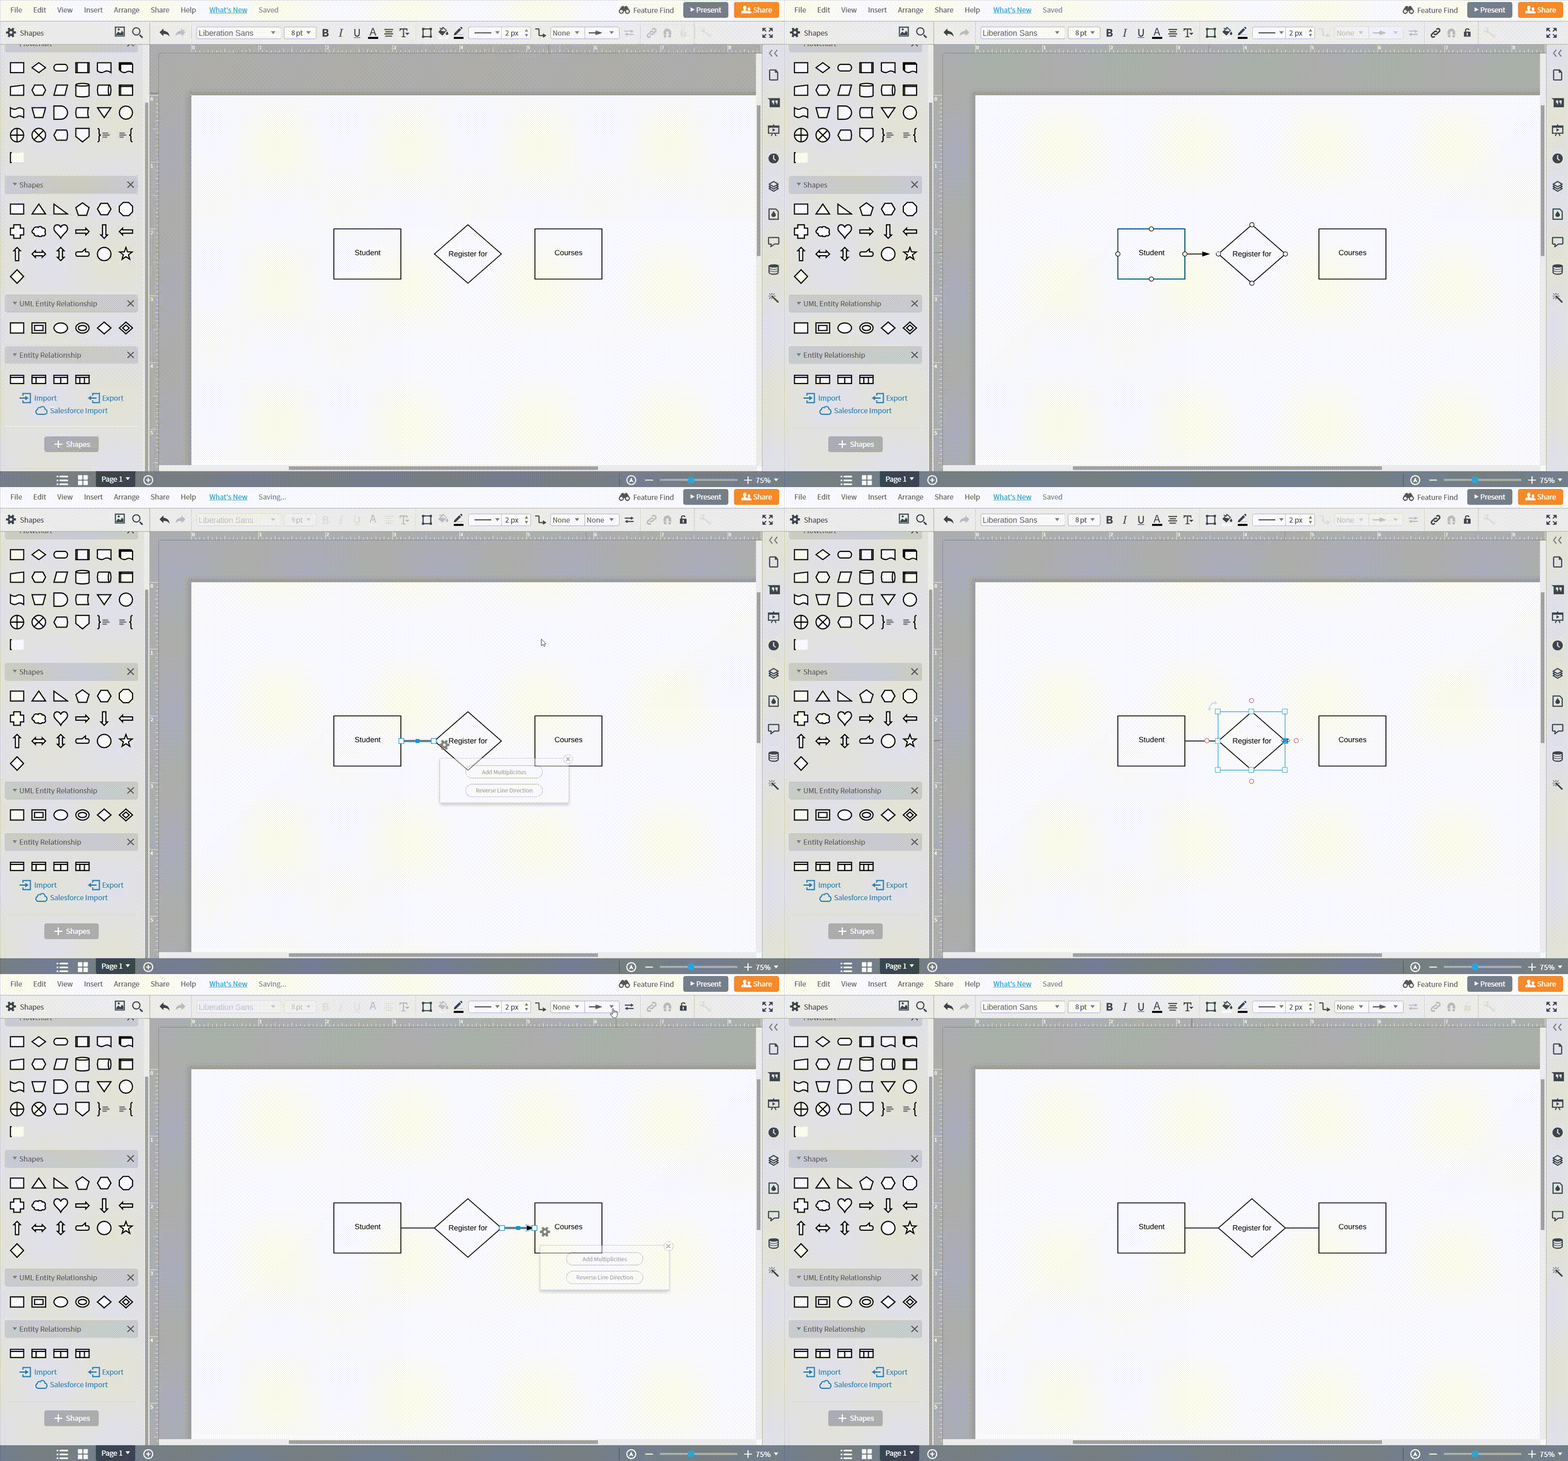
After placing the appropriate shapes on the canvas, connect the shapes by dragging out from the red dots at the borders of the shapes. Then, you can change the line ending in the toolbar above the canvas.

More tips for ER diagrams
-
Show the level of detail necessary for your purpose. You might want to draw a conceptual, logical or physical model, depending on the detail needed. (See above for descriptions of those levels.)
-
Watch for redundant entities or relationships.
-
If you’re troubleshooting a database problem, watch for holes in relationships or missing entities or attributes.
-
Make sure all your entities and relationships are labeled.
-
You can translate relational tables and ER diagrams back and forth, if that helps you achieve your goal.
-
Make sure the ER diagram supports all the data you need to store.
- There may be different valid approaches to an ER diagram. As long as it provides the necessary information for its scope and purpose, it’s good.
ERD Templates and Examples
Database ER Diagram Template
A database ER diagram help you visualize how entities within a database relate to each other and the attributes of each entity. This example illustrates entities involved in the school system.

Customer Purchase Order ERD Template
This sample ER diagram illustrates the entities, relationships and attributes involved in a customer purchase order. They allow you to visualize the data involved so it is easy to understand and communicate.

Library ER Diagram Template
This library ER diagram template keeps track of the data transfers that occur when someone checks out items from the library. An ER diagram allows anyone to easily understand the flow of data and effectively use it.
