Making an org chart is a great way to organize a complex organization into a simple structure. This guide will walk you through the process of creating your very own org chart on the medium of your choice, and teach you how to build an org chart in Lucidchart, a visual workspace that's ideal for diagramming org charts.
5 minute read
Do you want to create your own organization chart? Try Lucidchart. It's fast, easy, and totally free.
Getting started with Lucidchart
To get started, sign up for a Lucidchart account. Once you have created an account, open up a blank document or one of our org chart templates to get started.
Enable shape libraries
First, you’ll need to enable the “Org Charts” shape library. To do this, click on the “+ Shapes” button on the left side of your workspace, and make sure “Org Charts” is checked.
Create an org chart
Organizational charts are intended to organize and manage hierarchies within companies, institutions, departments, and even families. By creating an org chart, organizational structure will be more clear, providing more efficiency from within.
1. Start and style your org chart
First, determine the purpose of your org chart so that you can decide what you want your org chart to look like and what information you should include. You might use your org chart as an employee reference for contacting others in the organization, to create a staffing plan for the coming year, or to organize cross-functional teams.
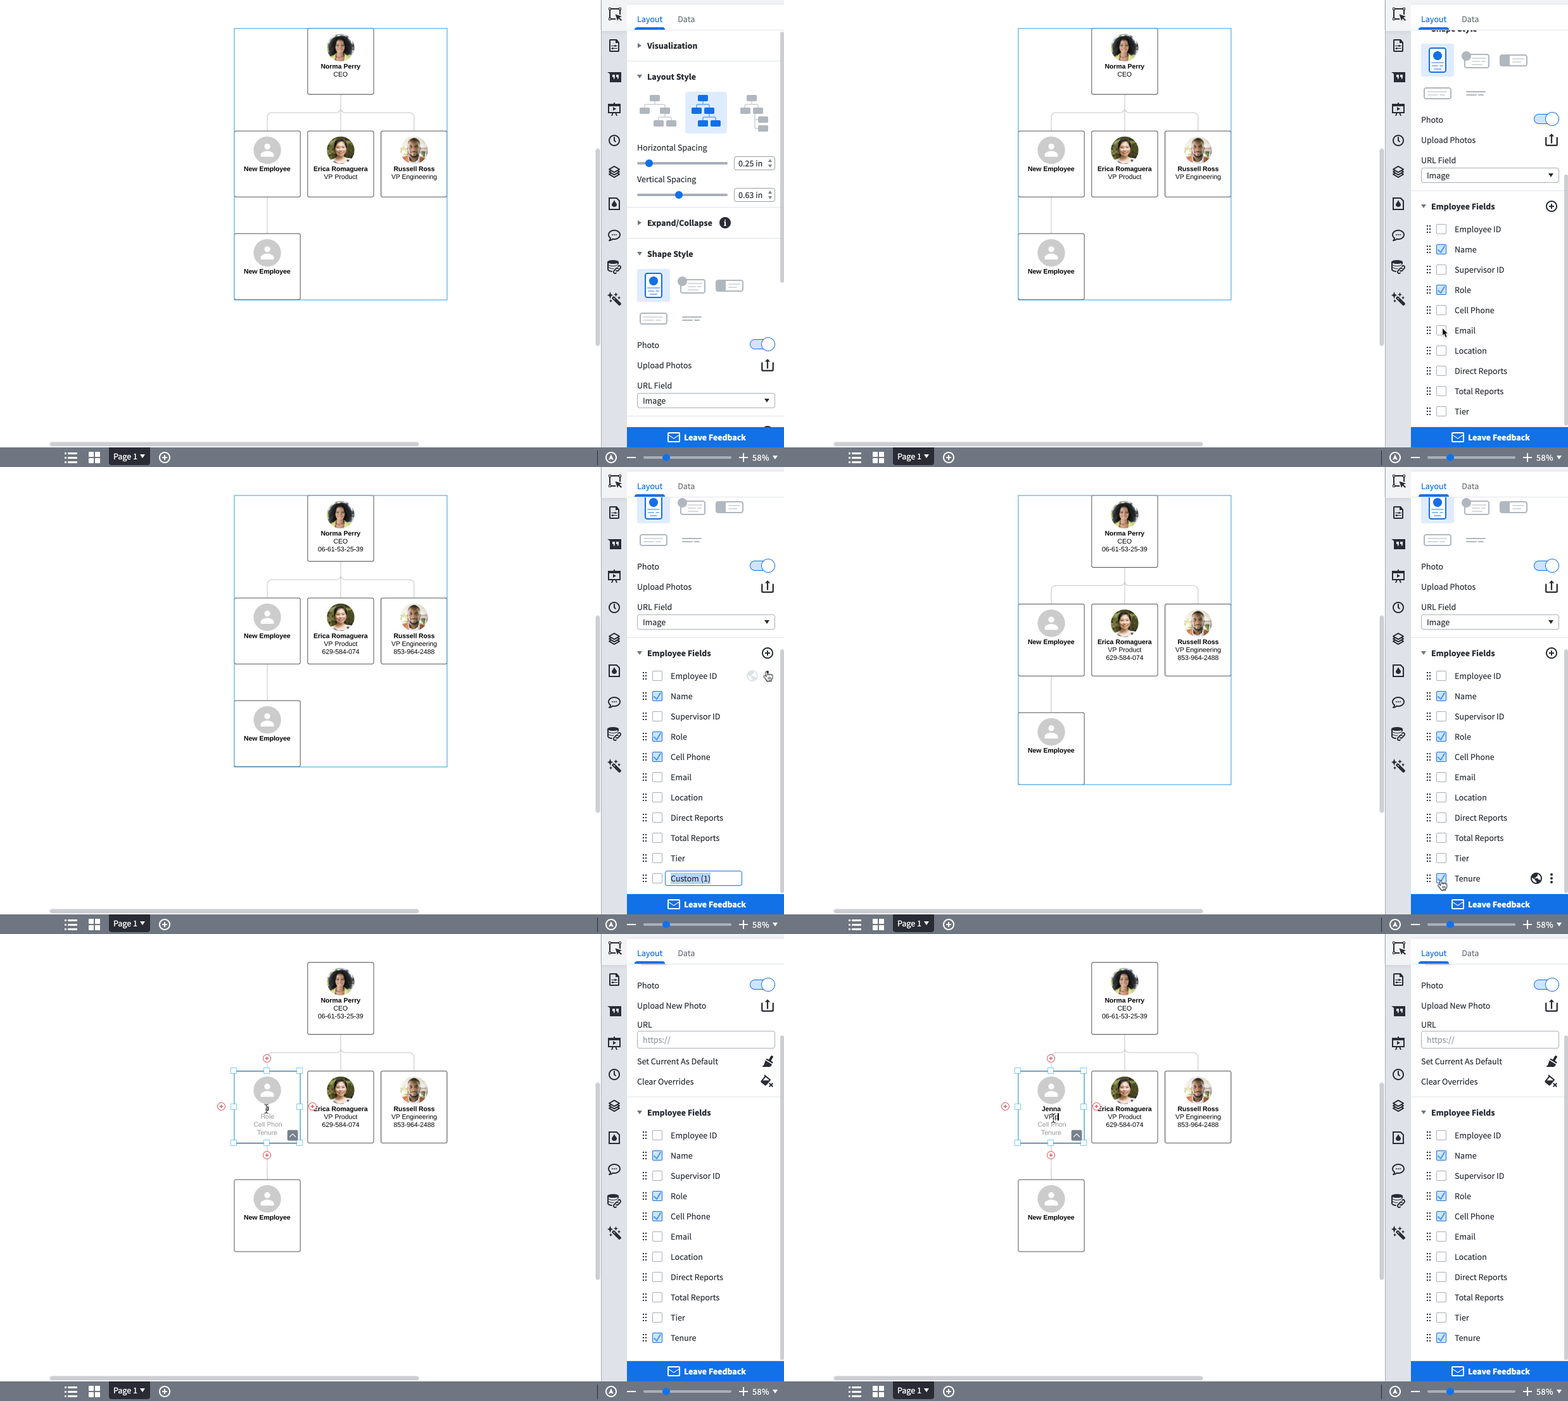
Once you have established the purpose for your org chart, drag and drop an org chart shape onto the Lucidchart canvas. When you double-click the shape, the context panel for org charts will appear on the right.
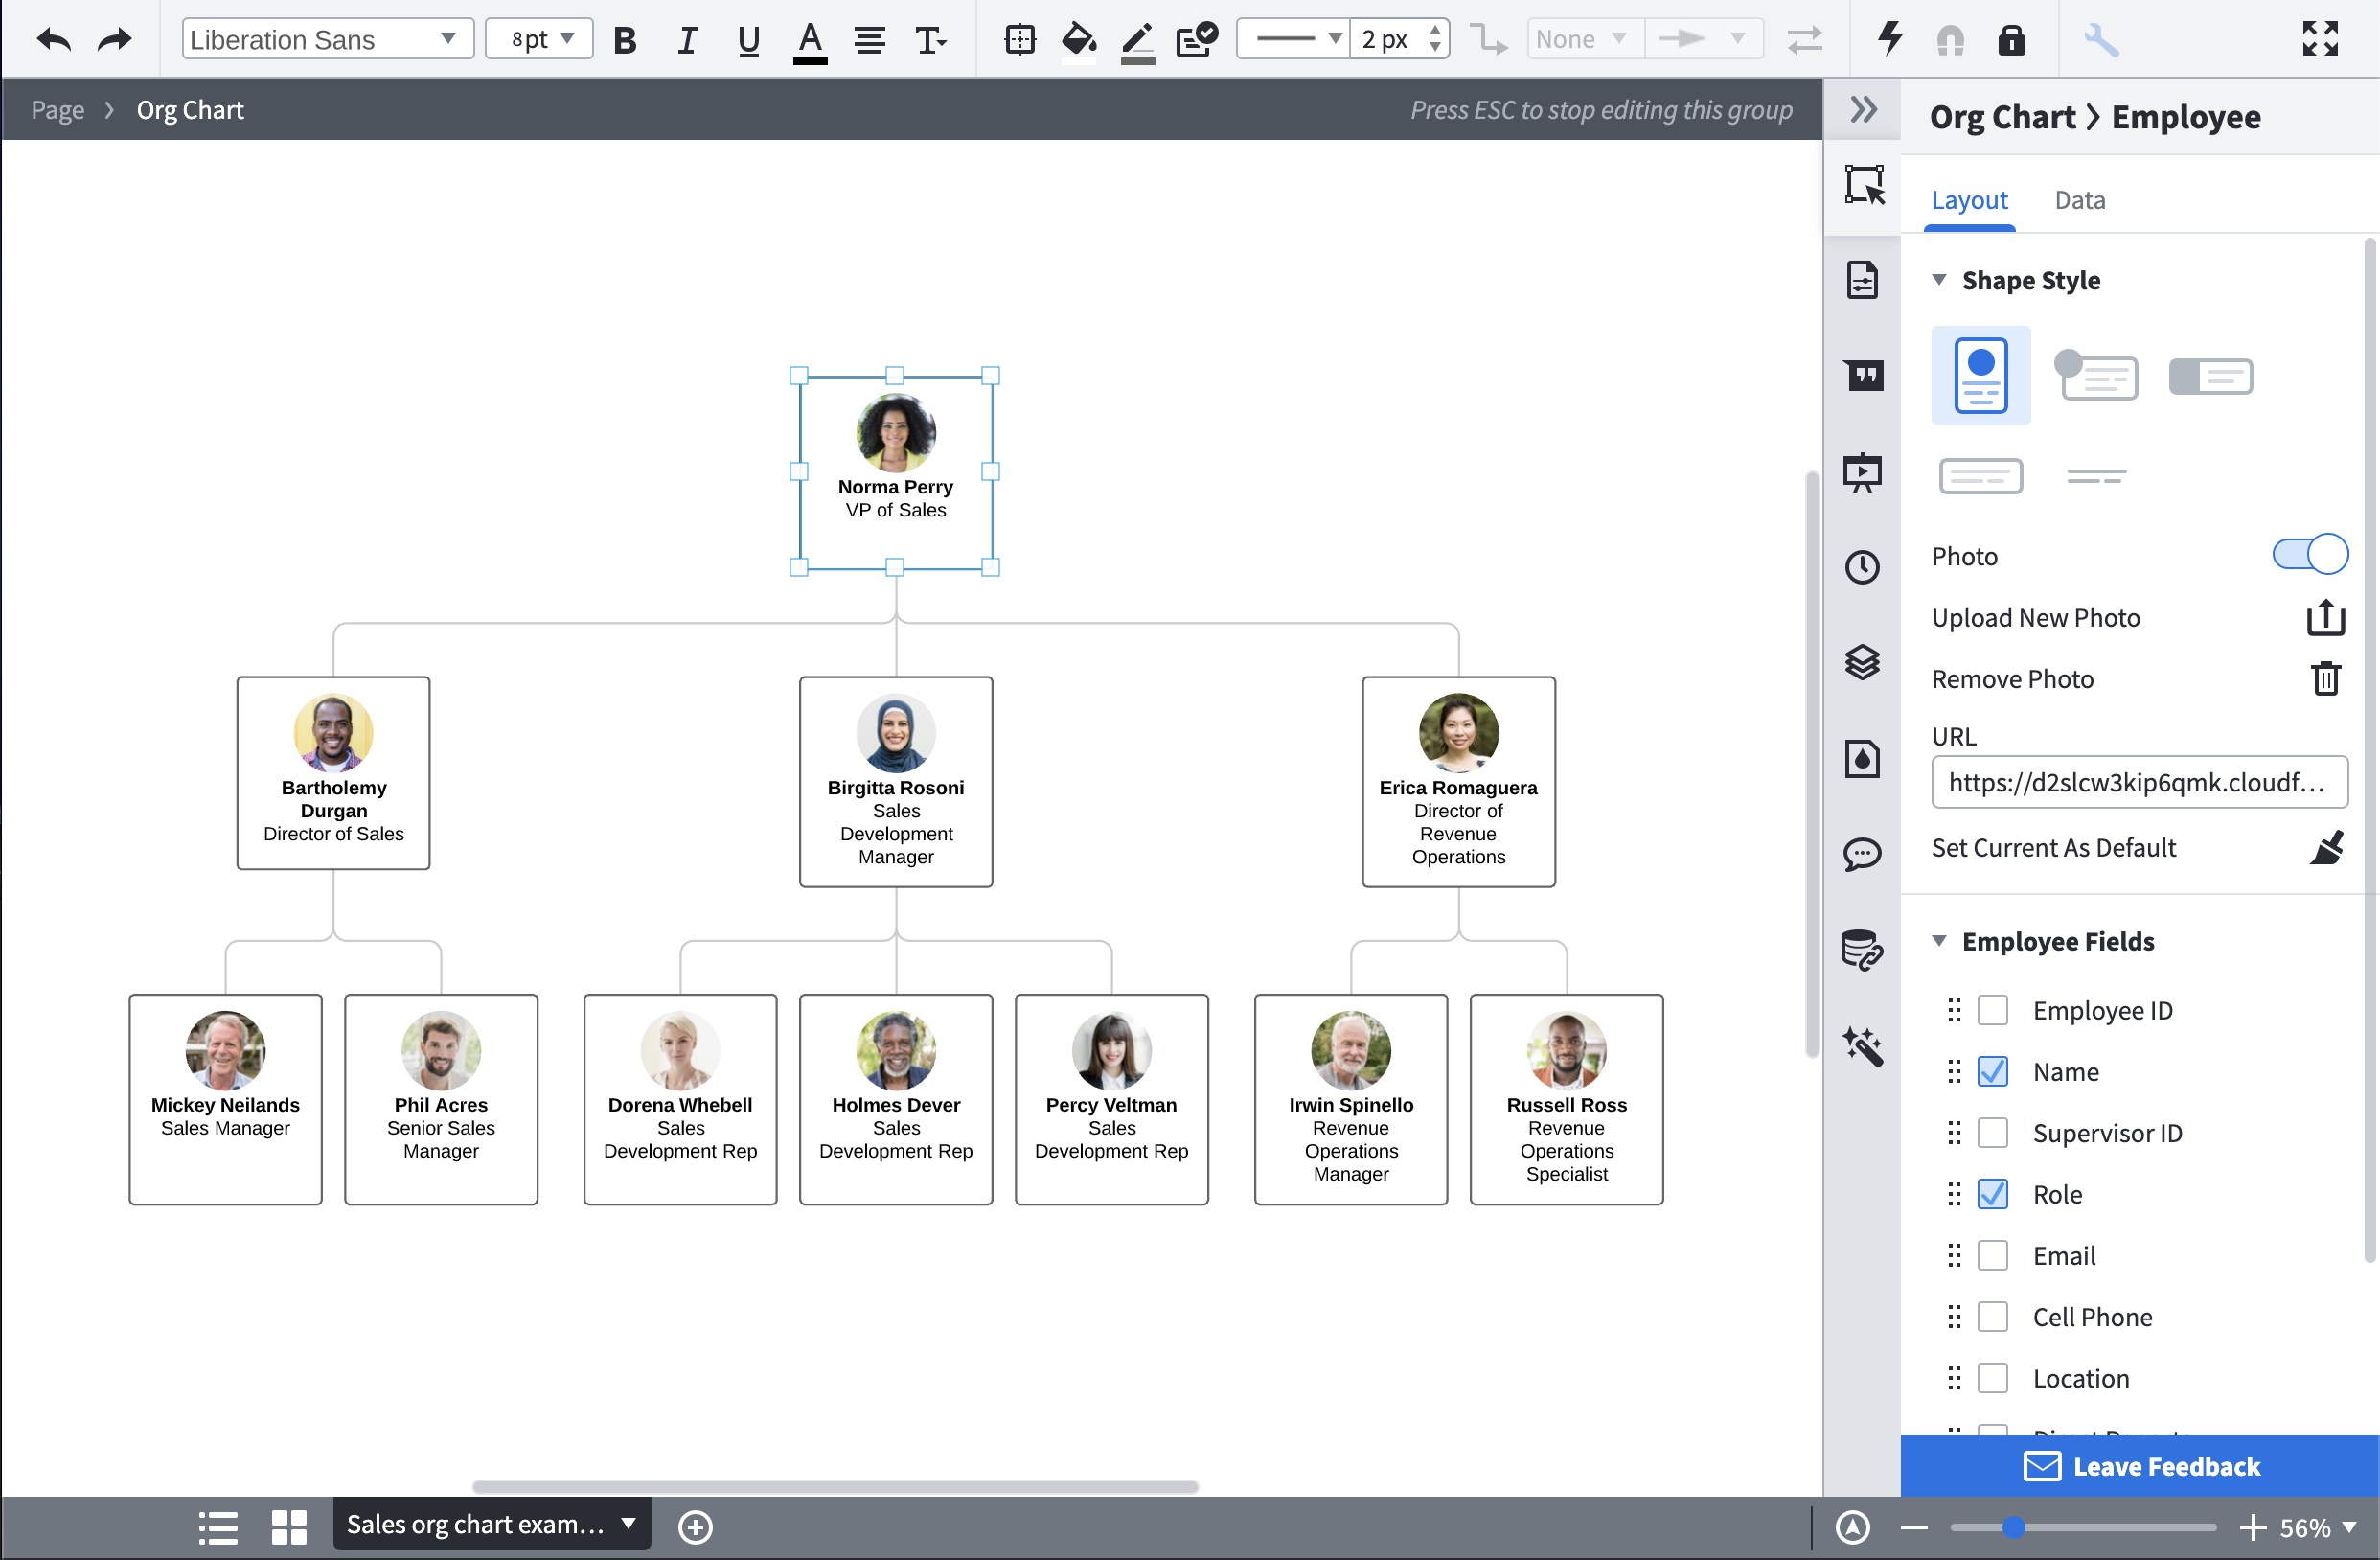
From that panel, you can format your org chart the way you want it—select the layout and shape style you prefer and choose which employee fields to include. You can select from a list or add your own custom employee fields.
2. Add shapes to represent each person in your organization or team
Next, create a shape for each person within the team, department, or organization you’re visualizing. We recommend starting from the top of the organization and working down. For instance, you could start with the CEO or team lead, and then add everyone who reports to them.
To add additional org chart shapes in Lucidchart, you can either click the red “+” buttons around the existing shapes or, within the context panel, go to Data > List View to add employees in a list format.
Lucidchart makes it easy to edit your org chart. Whether you’re looking to transition employees to new teams, change reporting structure, or model other aspects of your organization, drag and drop shapes to move employees around. Lucidchart will automatically adjust the shape spacing and lines so that your org chart remains clear and professional.

3. Add information to shapes
As a starting point to making your org chart a helpful resource for employees, you can include information such as name, role, contact information, and location. Click any shape to edit the employee data within it, and add other employee fields from the context panel.

Do you want to create your own organization chart? Try Lucidchart. It's fast, easy, and totally free.
Create an organization chartHow to automate an org chart with data import
Save time by importing the information that you want to include instead of creating your organizational chart manually. Lucidchart has built-in functionality to build your organizational chart automatically.
Please note that this feature and the ability to connect to a data source are only available for paid accounts.
Organize the data in a spreadsheet
To create your org chart automatically, first organize your information in a spreadsheet with the desired information. Be sure to save the file as a CSV. Here are some of the fields you may consider including:
-
Name
-
Employee ID
-
Department
-
Job Title
-
Phone
-
Email
-
Reports To

Import the data into Lucidchart
Once you have created the spreadsheet, you can import the data into Lucidchart by clicking on the “Import Data” button located in the org chart shape library.

Then, follow the prompts to create your org chart. Lucidchart will automatically import and organize the data from your CSV, Google Sheet, or Excel file, saving you time and energy!

If you need some additional help, read our explanation on importing and formatting data for org charts in Lucidchart.
How to format an org chart
To make your org chart more visually appealing, play around with different fonts, sizes, and colors. Completely customize your org chart by clicking on any shape and then changing its properties from the formatting bar. (Tip: You can also click and drag to select multiple shapes and then edit them simultaneously!)
You can also use conditional formatting to highlight specific information across your organization. For example, you could highlight tenured employees, highlight different skill sets, or even identify gaps in your org visually.
If you prefer to standardize the styling of your shapes, start by styling one shape exactly how you want it. Then, you can easily apply the same formatting to the rest of your diagram by clicking “Set Default Shape Style” at the top of the workspace. Any additional shapes you add will be formatted according to this default style.
To adjust the spacing and layout of your org chart elements, click “Layout”—this is located in the context panel on the right. (If you don’t see the context panel, simply double-click one of your shapes to open it.)
From that panel, you can add additional data fields to your shapes, toggle employee pictures on and off, and change the style of each shape. Any additional data fields that you add will be populated by filler text—to edit them, just double-click on the text you wish to change.
Get more from your org charts
Though org charts are primarily used to visualize hierarchy, they often contain far more than just hierarchical information. Org charts can be a great place to store employee-specific details—like employee tenure, location, or team assignments—but you need a good way to access and visualize that information.
With Group View, you can arrange your org chart based on non-hierarchical factors. You can, for example, choose to view members of your organization by team, location, or supervisor ID. Lucidchart helps you visualize this information by generating a new, easy-to-understand diagram from your org chart—this new diagram is arranged not by hierarchy, but by a criterion of your choosing.
To use Group View, follow the steps below:
- Open the context panel by double-clicking on a shape in your org chart.
- Click Layout > Visualization and select “Create Group View.”
- Click “Choose Field.” From the drop-down list, select the data point that you want to focus on.
- Click “Create Group View,” and you’re all set!
Lucidchart automatically creates a new diagram—located on a new tab—arranged according to the field you selected (location, for example).
Please note that the Data Linking feature is only available for Enterprise accounts.
Still have questions about Group View? Watch our step-by-step video tutorial.