
A quick guide to different types of entity relationship diagrams
Reading time: about 8 min
People often use sketches, maps, diagrams, and other visual aids when planning and designing a project.
For example, writers might draw maps when developing a story. This helps them to understand the environment, geography, geology, flora, and fauna of the world that their characters will inhabit. The more they understand how these various entities relate and interact with each other, the more believable the world will be to their readers. And the easier it will be for the characters to interact with each other while adhering to the guidelines created by the writer.
The same is true in the business world. Project managers and developers often use visuals such as flowcharts, maps, and other diagrams to plan and design a variety of projects, such as software, processes, network architecture, databases, and so on.
For example, when designing a database, you’ll want to understand the world that your data will live in. You need to be able to see how all the parts relate and interact with each other. By understanding the rules you create for your database, you can more easily avoid data redundancy and ensure that data is accurate and comprehensive.
Redundancies can lead to discrepancies, and inaccurate data will have a negative impact on analysis and reporting. An entity relationship diagram (ERD) is a good visual tool that can help you to design a logical, clean, and secure database that adheres to the rules you establish for it.
What is an entity relationship diagram?
What is an entity relationship diagram?
An ERD is a diagram that helps you to see how different entities relate to each other in a system. These diagrams are used when you design a new system to help the development team to understand how the database should be structured. ERD diagrams are also useful to help you to understand how existing systems work and for finding and resolving problems.
An ERD is a diagram that helps you to see how different entities relate to each other in a system. These diagrams are used when you design a new system to help the development team to understand how the database should be structured. ERD diagrams are also useful to help you to understand how existing systems work and for finding and resolving problems.
These diagrams use a defined set of shapes and symbols (rectangles, diamonds, ovals, connecting lines) that let you document the logical structure of your database. The shapes and symbols provide a common language that makes it easy for everybody to see and understand how the system works, where the data is located, and how to access it when they need it.
This common graphical language is analogous to written language, with entities acting like nouns and the relationships and connectivity acting like verbs.
Entity
An entity is any kind of data object that is important to your business. These objects can be computers, printers, employees, customers, places, events, concepts, and so on.
An entity is like a noun. It is a thing that has data stored about it. For example, a pizza order and the customer who orders it are entities that can be stored in a database.
You can put entities into entity sets, which are collections of entities that share common attributes. For example, you might have a lot of pizza entities in one data set that share attributes such as size, crust, sauce, cheese, etc. But the values for many of these attributes might be different, such as crust type (thin, deep dish) and amount of sauce (light, normal, extra).
Attributes and relationships
Attributes are what define the properties of the entities in your database. Using a pizza as an example of an entity, the attributes might be medium, deep dish, light sauce, extra cheese, and pepperoni. In addition, you might have a customer entity set that has different values for name, address, payment information, and so on.
When entities and attributes have been defined, you can set up the relationships between them. A relationship describes the connection or association between one or more instances of entity types. Relationships can be thought of as verbs or verb phrases.
So a customer named Bob (entity, attributes) might order a medium deep dish pepperoni and have it delivered to his house (entity relationship).
This type of information is useful for the pizza restaurant and the customer. The restaurant can send the customer targeted ads based on previous orders. The customer can quickly order the next time they visit the restaurant website because their information, including previous orders and payment information, is stored in the database.
Types of entity relationship diagrams
There are several different types of ERDs you can use. Here we’ll discuss three of the most well-known types and the benefits of using each.
Crow’s foot
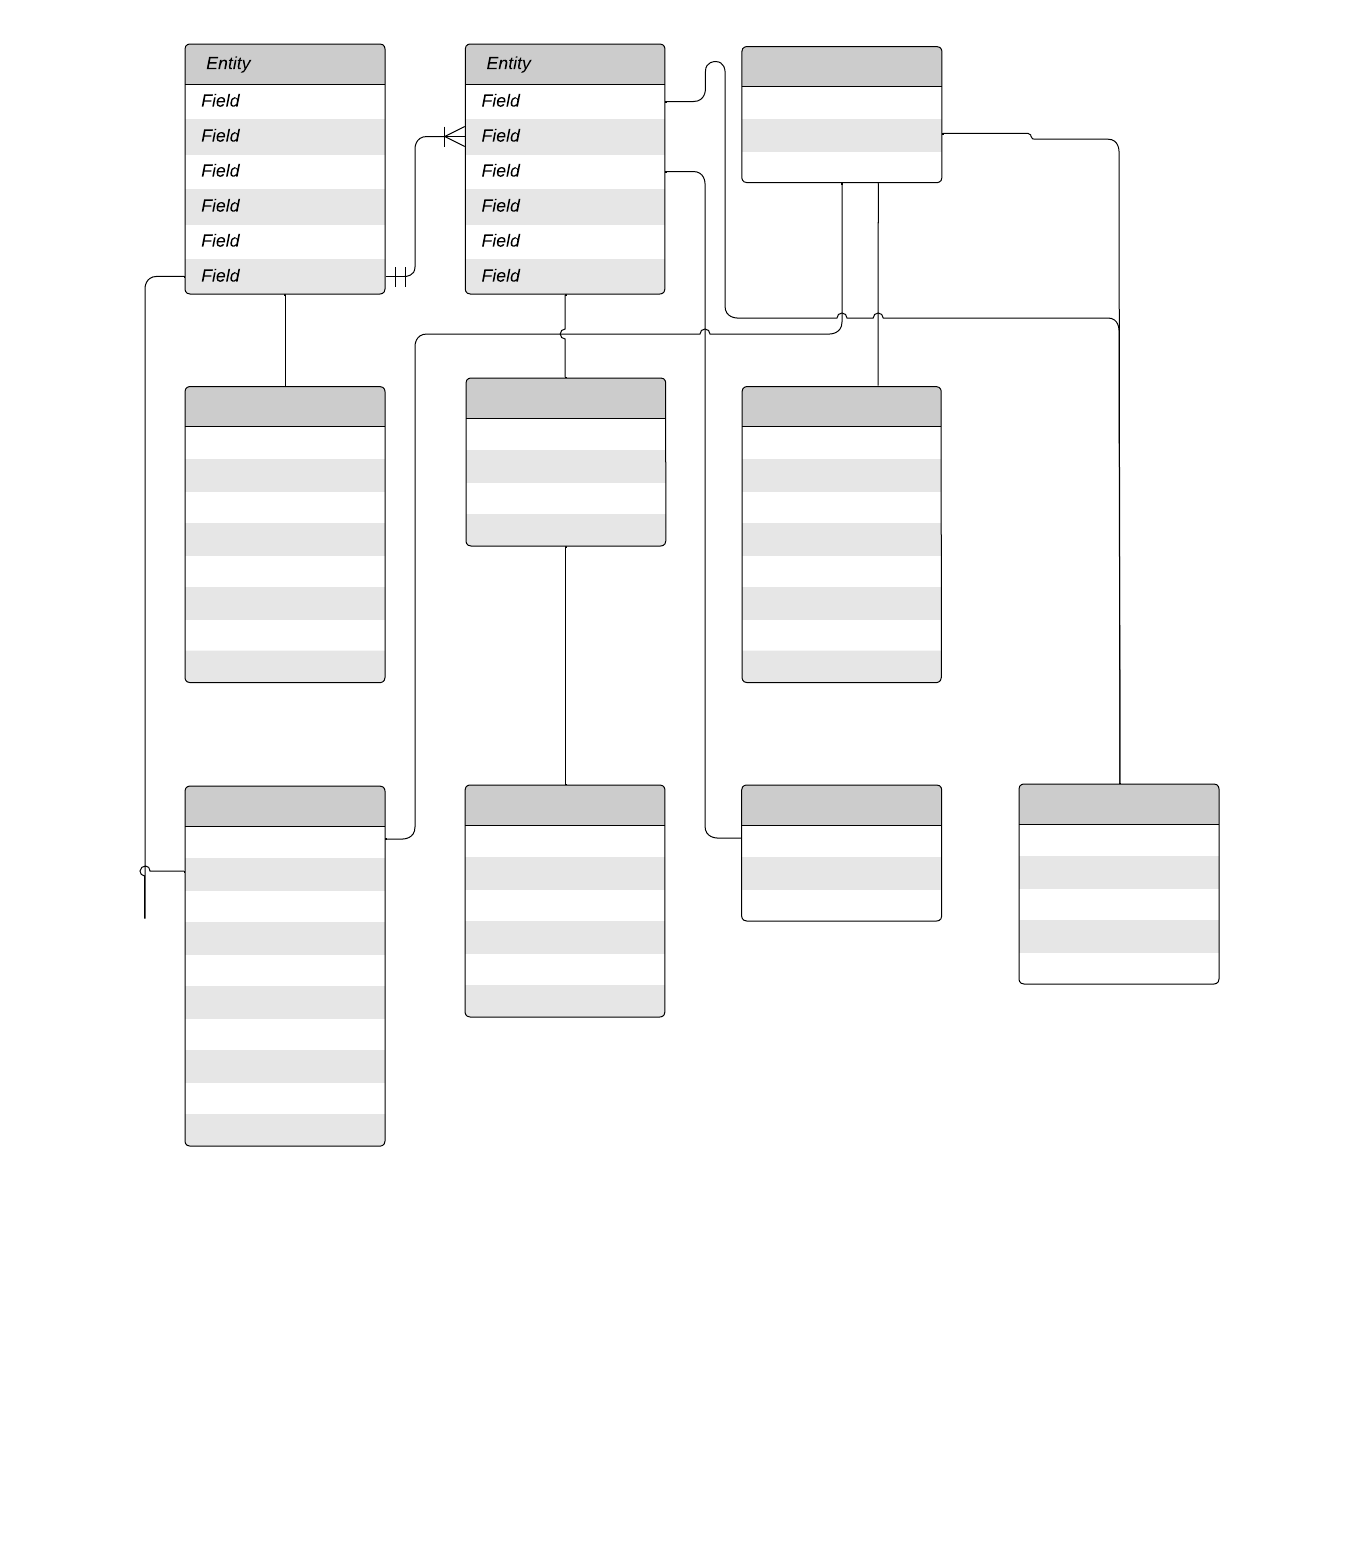
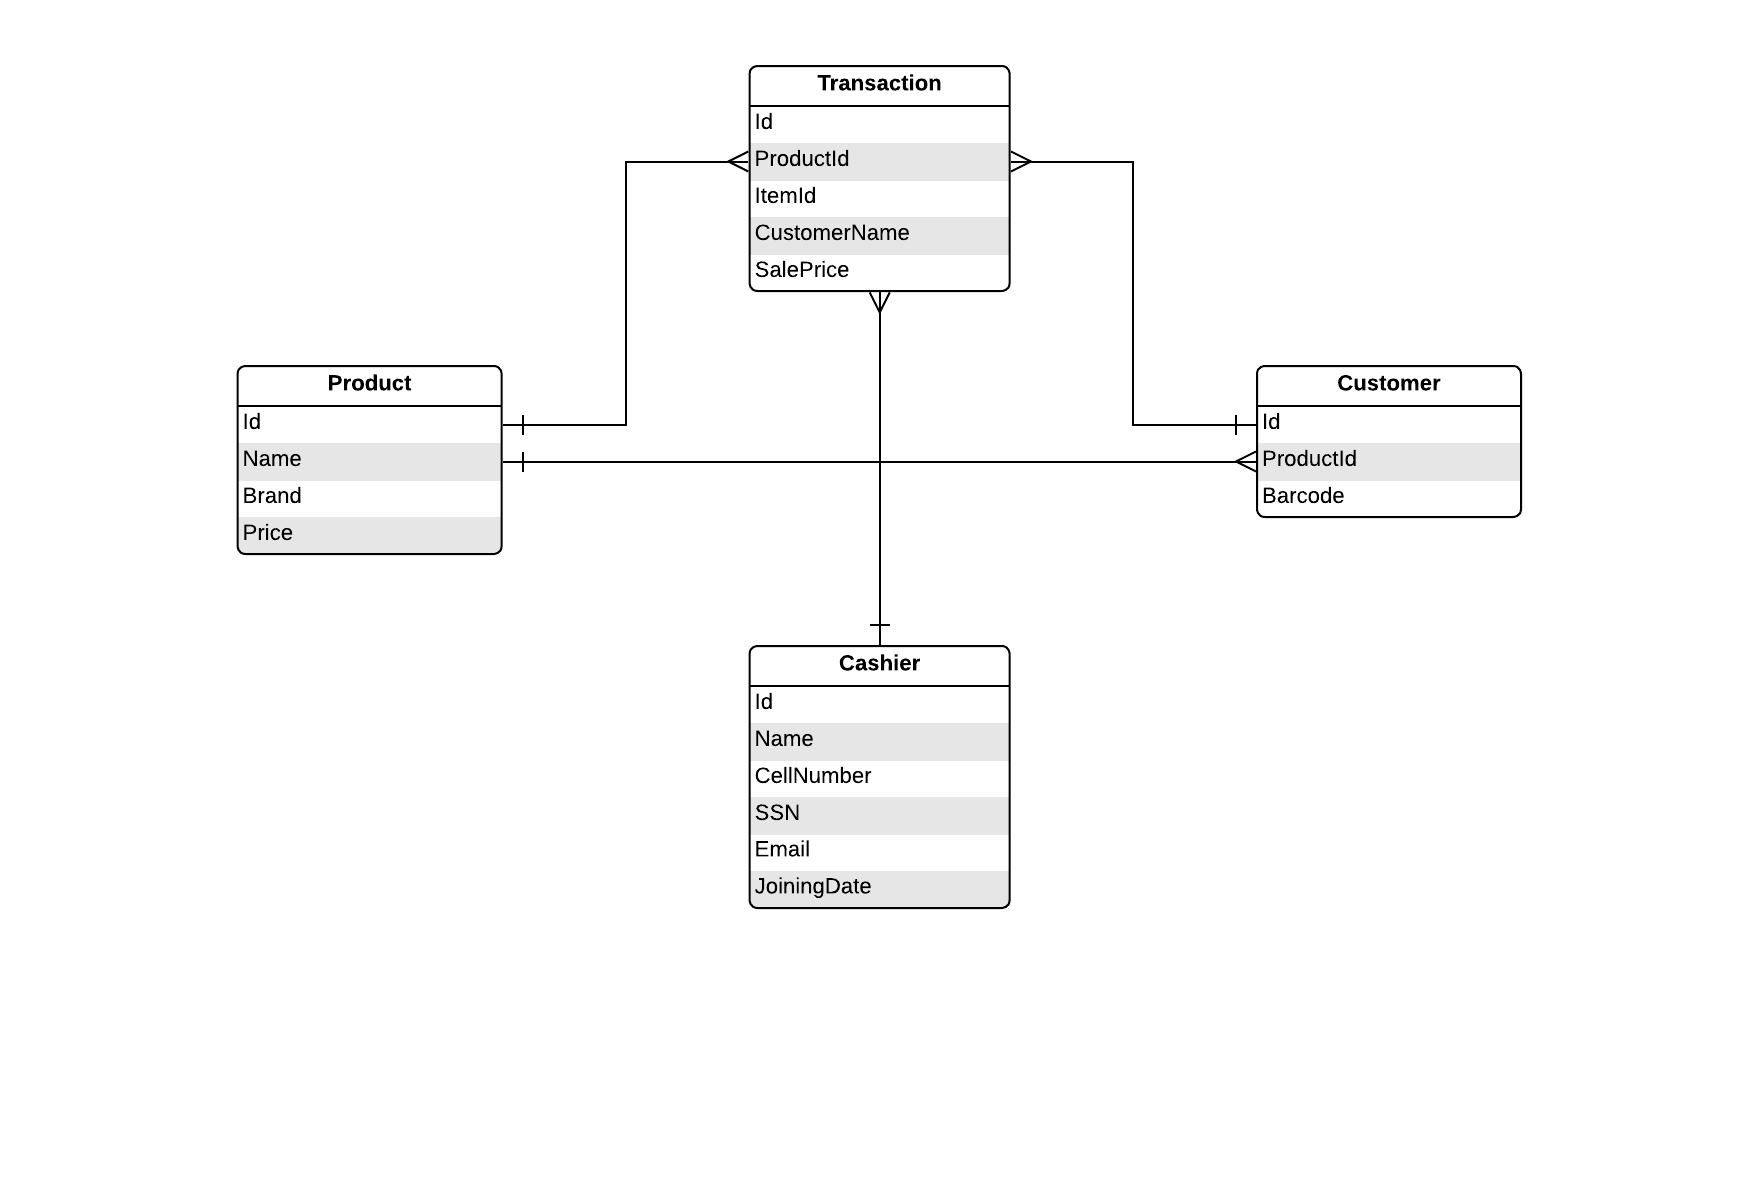
This method for creating ERDs uses crow’s foot notation. With this notation, boxes represent entities and lines represent the relationships between the boxes. There are different shapes at the end of these relationship lines that represent the relationship cardinality—the maximum number of times an instance in one entity can relate to instances of another entity.
There are three main cardinal relationships:
One-to-one: One customer orders one pizza.
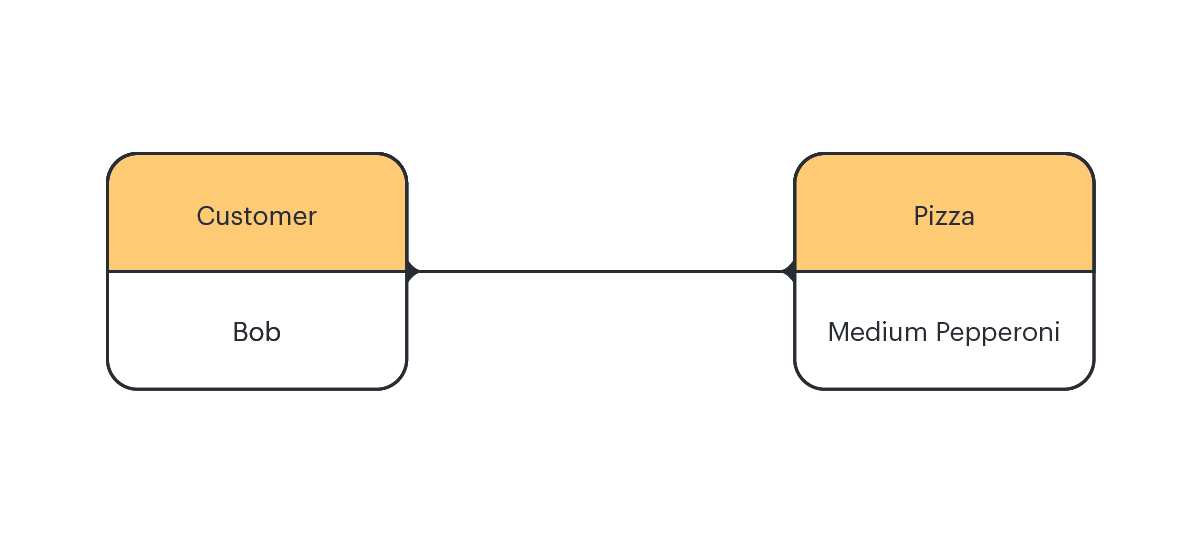
One-to-many: One customer orders a variety of pizzas. Each pizza has a single relationship back to the customer.
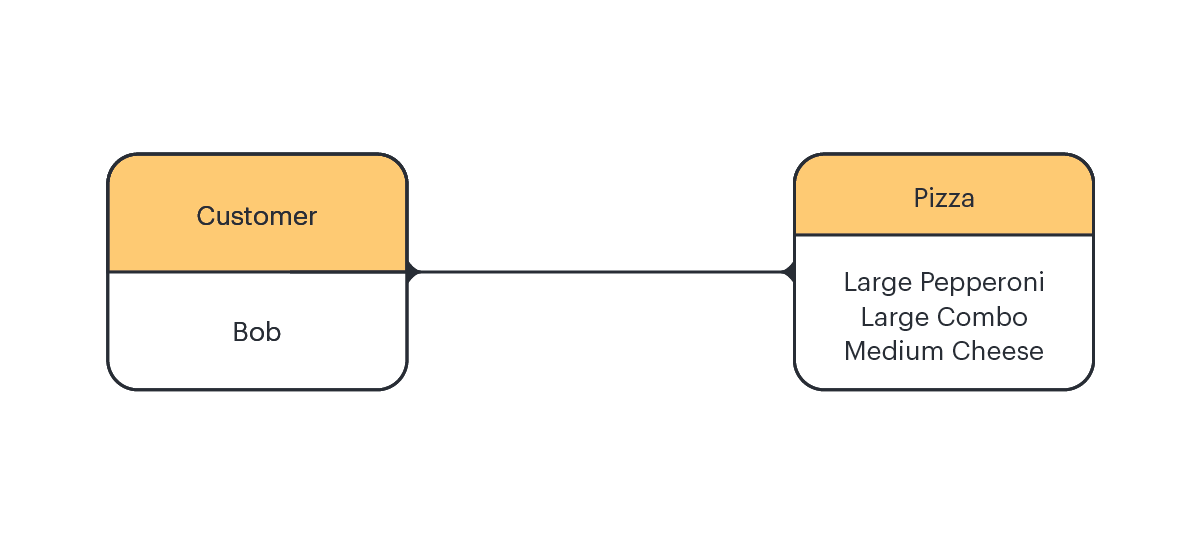
Many-to-many: Several customers order a variety of pizzas.
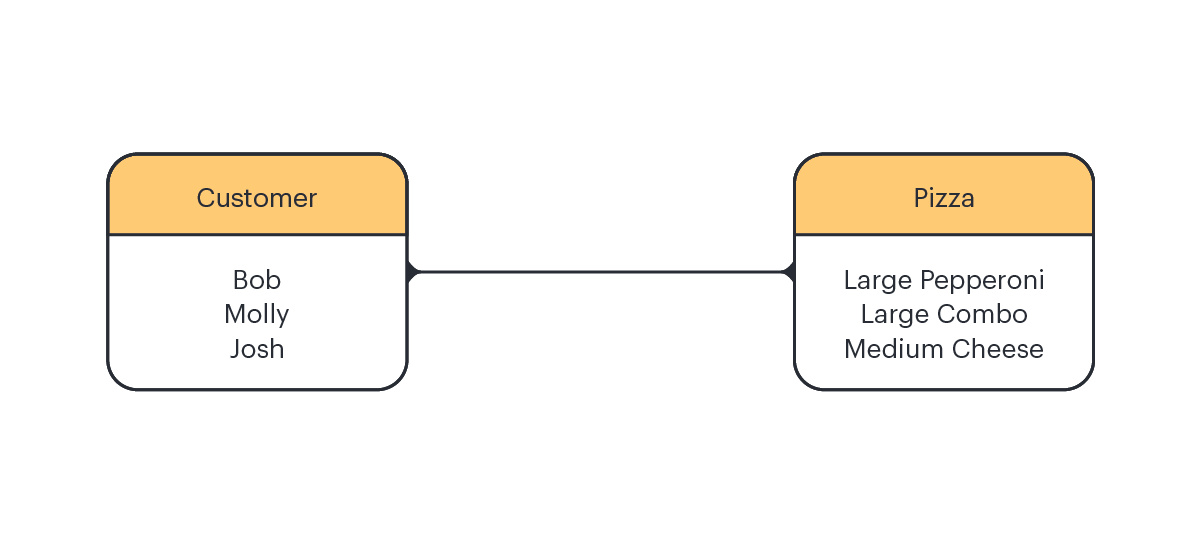
Benefits of the crow’s foot model
- Useful for diagramming relationship cardinality
- Notation makes maximum and minimum cardinality clear in a visual way
- Symbols are easy to read and interpret by all stakeholders
- Cardinality symbols are placed and remain on the relationship line where they are easily identified in a complex diagram to eliminate ambiguity
- Good for drawing plans that need to be reviewed by a less technical audience
NoSQL database design
A NoSQL database refers to a non-relational database. It is also referred to as “not only SQL” to indicate that the database might also support SQL-like queries.
NoSQL database design emphasizes simplicity with better scaling and more control over availability. The database does not use the tabular structure that is typical in a relational database. Instead, NoSQL stores the data within one data structure, such as a JSON document. This type of database structure does not have a strict schema. Flexible schemas mean that this database design can scale much more rapidly so you can manage large, and sometimes, unstructured data sets. That’s why NoSQL database design is popular with companies that use real-time web apps.
The decision for using a NoSQL database design depends on the problem you want to solve. If data needs to be strictly structured, you might want to use a relationship design. But if you need your database to be more flexible and you want your users to be able to access data more rapidly, a NoSQL design might be right for you.
Benefits of NoSQL database design
- High scalability: NoSQL uses horizontal scaling by distributing data across multiple machines (sharding). With vertical scaling, you need to add more resources to an existing machine, which can be difficult to accomplish. With horizontal scaling, you simply add more machines to store the data, making it much easier to efficiently handle huge amounts of data.
- High availability: NoSQL supports automatic replication. This means that if one part of the system goes down, the data is still available because it has been replicated. This also gives you a disaster recovery mechanism.
- Reliable for big data: Large amounts of data are generated every day. NoSQL systems such as MongoDB or Hadoop let you store the data quickly, securely, and appropriately.
- More agile/flexible data models: Relational databases can cause headaches when there are changes in storage and operational architecture. Even minor changes may need to be monitored closely. NoSQL systems don’t have these types of limitations. They are flexible and can quickly handle any type of change.
Entity relationship diagrams with UML notation
Universal modeling language (UML) is a popular language that is primarily used by software developers to describe and visualize systems developed using object-oriented methods. UML has its own library of standardized notation symbols that represent objects and processes that make up an application or software system. Like any visual notation, it makes it easier for the people who use it to visualize and understand their ideas without having to look through thousands of lines of code.
There are several different kinds of UML diagrams, such as object, package, sequence, state machine, timing, component structure, communication, etc.
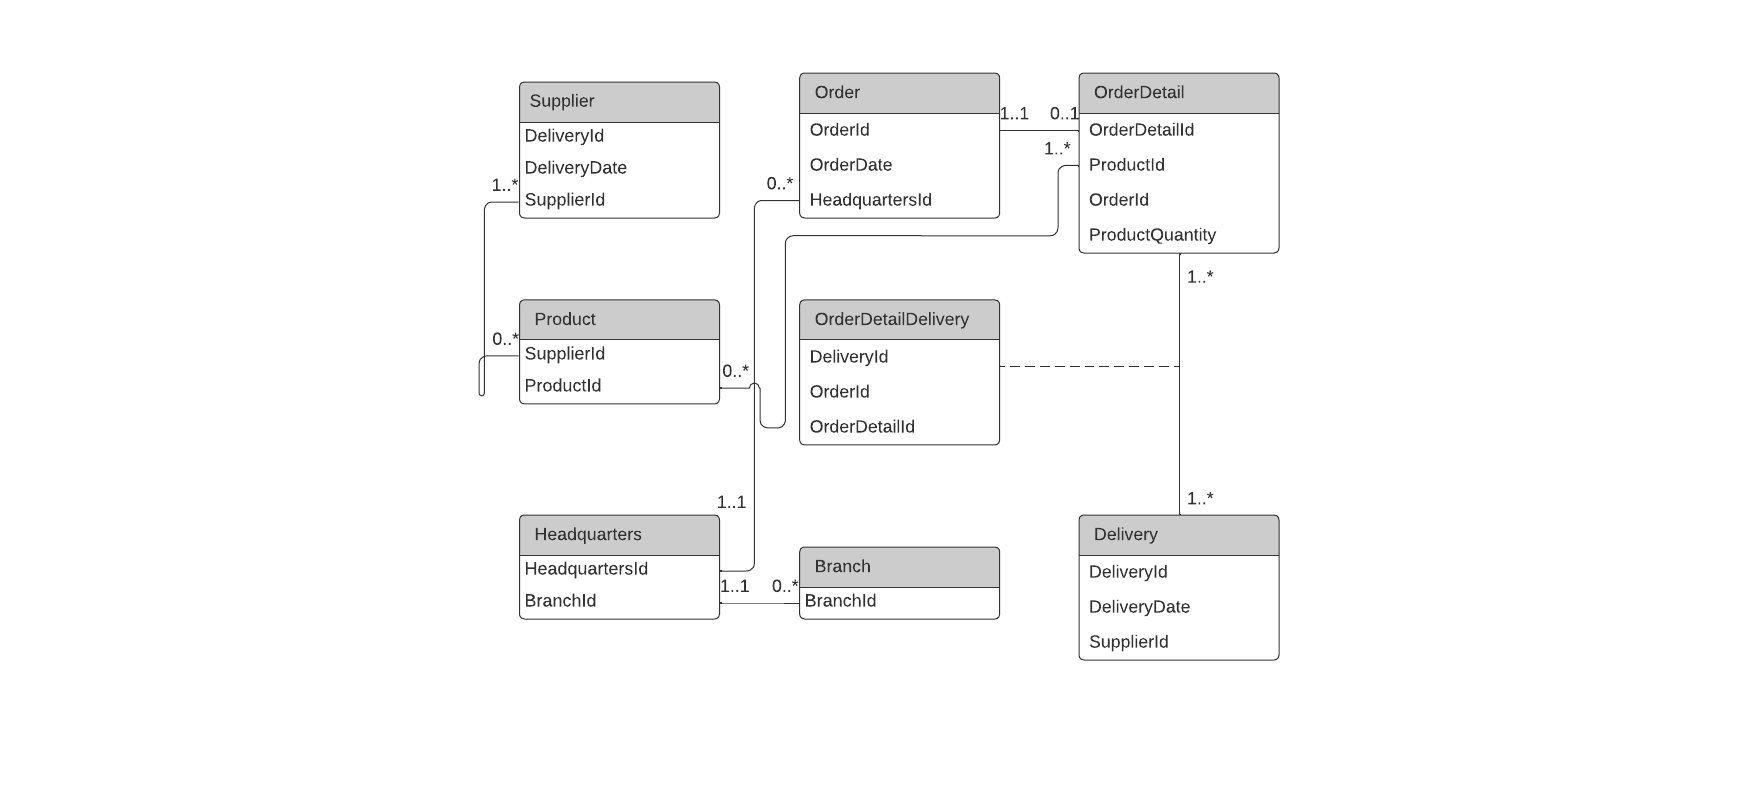
UML notation can be used when creating ERDs. This does not mean that the ERD becomes a type of UML diagram. Instead, it simply means that UML notation is used to describe entity relationships and cardinality. With the UML notation, relationships are shown as a solid line connecting two entities. Cardinalities are indicated on the line (for example, 1..1 indicates one-to-one, or 1..* for one-to-many) and you can add verb phrases (like “made by” or “ordered by”) to define the relationship between the entities.
Creating ERDs is easy and flexible. Using an intelligent diagramming application like Lucidchart, you can create any type of ERD to suit your needs. The extensive shape and template libraries let you easily draw any type of visual business document. Lucidchart also makes it easy to collaborate in real time as any authorized team member can access documents from anywhere at any time.

Lucidchart can help you create and share ERDs quickly.
Learn moreAbout Lucidchart
Lucidchart, a cloud-based intelligent diagramming application, is a core component of Lucid Software's Visual Collaboration Suite. This intuitive, cloud-based solution empowers teams to collaborate in real-time to build flowcharts, mockups, UML diagrams, customer journey maps, and more. Lucidchart propels teams forward to build the future faster. Lucid is proud to serve top businesses around the world, including customers such as Google, GE, and NBC Universal, and 99% of the Fortune 500. Lucid partners with industry leaders, including Google, Atlassian, and Microsoft. Since its founding, Lucid has received numerous awards for its products, business, and workplace culture. For more information, visit lucidchart.com.
Related articles
What is an entity relationship diagram?
Learn the essentials of ER diagrams and ER models, including their origins, uses, examples, components, limitations, and guidelines on how to draw them.
ER diagrams vs EER diagrams
Learn the differences between ER and EER diagrams. Access free tools to help you easily create your own!
