
If you're working with relational databases, you need a way to understand the structure and logic behind them if you're going to get anything done. Enter: ER and EER diagrams. These diagrams help you view what's in your database and how the data relates to each other in a simple, clear way.
ER and EER diagrams are similar, but not quite the same. ER modeling for database design was developed in the 1970s, and EER diagrams further built on those concepts to create something better suited to highly complex systems. While you can use either model for many relational databases, sometimes you're better off with one or the other.
Keep reading to learn more about ER and EER diagrams, which model you should choose for your situation, what limitations these diagrams have, and how Lucidchart can help you create them.
What is an ER diagram?
ER diagrams (ERD), or entity-relationship diagrams, are a way to chart the components of a system (people, concepts, or objects, and how they relate to each other). Database architects and administrators use them to map out relational databases when they plan them out or when they're debugging them. Because the diagram visually shows the structure and logic of your database, you'll have an easier time understanding and managing it, even if it's very complex.
While you can include lots of kinds of information in ER diagrams, the six most common elements that you will include are:
-
Entities: You can think of these as nouns, or the people or things in your database.
-
Attributes: These describe a characteristic of a particular entity.
-
Relationships: Think of relationships like verbs—they show the action an entity takes that affects another entity.
-
Weak entities: These entities depend on other entities (non-dependent entities are often called strong or parent entities).
-
Multivalued attributes: These attributes have more than one value.
-
Weak relationships: They are the relationships between a weak entity and its strong entity.
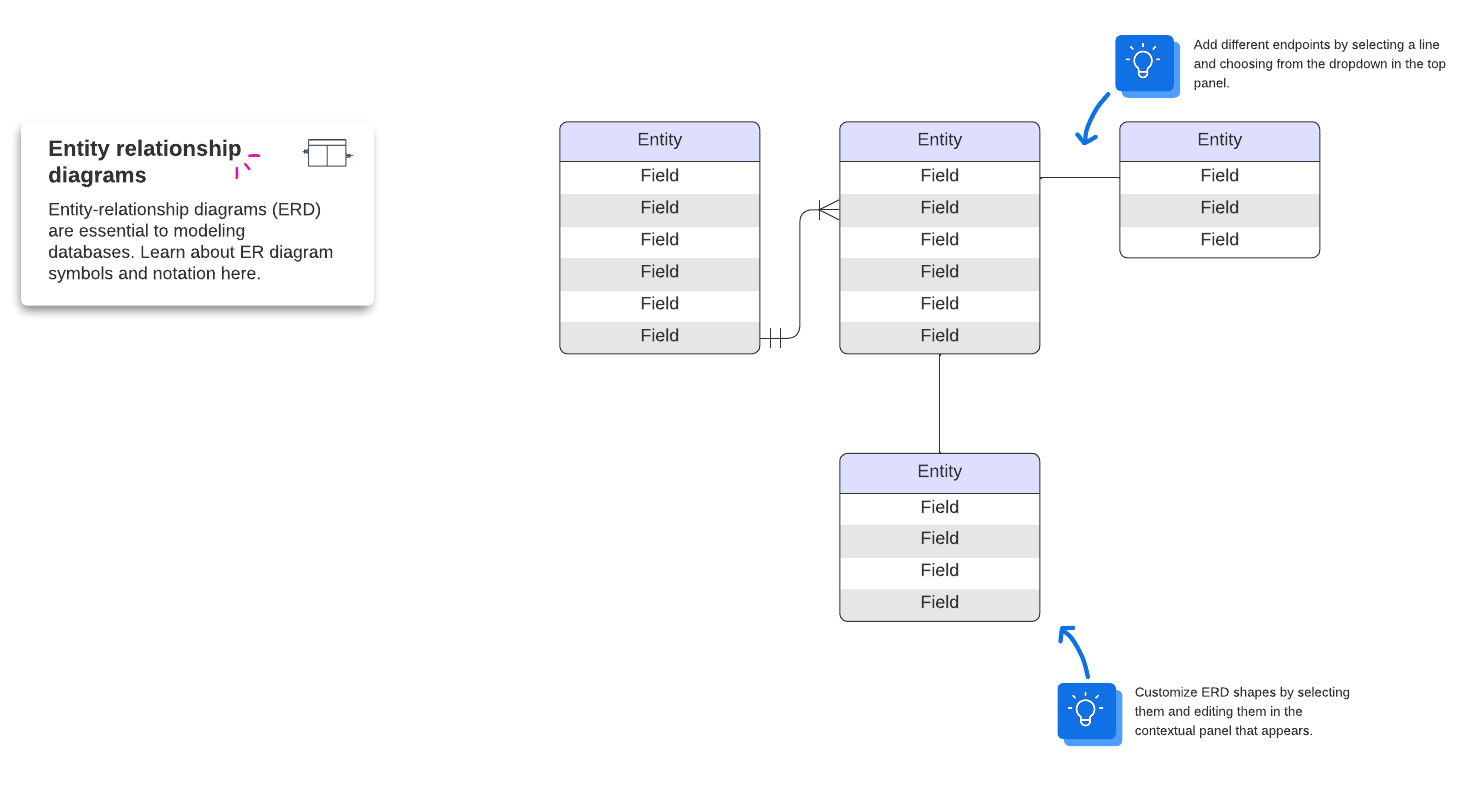
You can draw ER diagrams in a variety of styles. The simplest version may be crow’s foot, also known as Martin or Information Engineering style. These ER diagrams are essentially tables linked with crow's foot notation. Each table includes an entity and its attributes, and the notation linking the tables shows the relationship between entities.
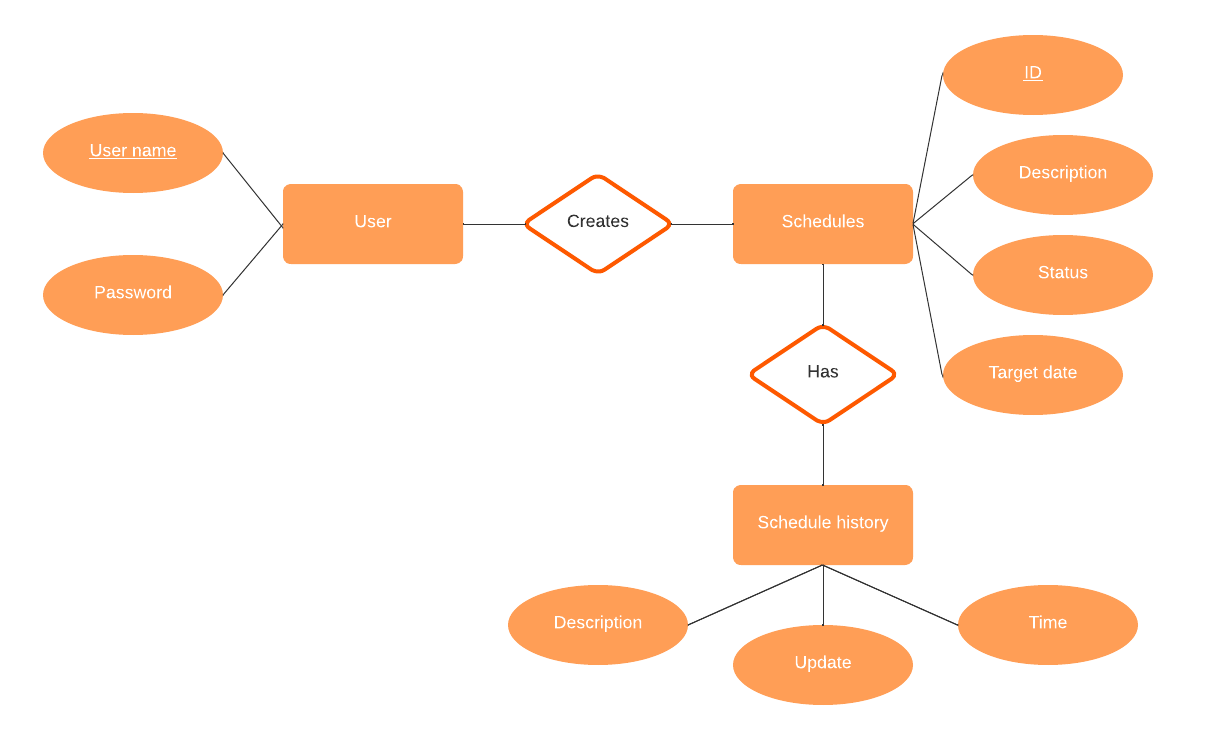
Another common style for ER diagrams uses Chen notation. Here, you use differently shaped containers around each element to show information. For example, entities go in rectangular containers, while attributes go in ovals. The end result looks more like a web of entities and attributes.
Explore the different types of ERD notation.
Go nowNo matter how you choose to draw an ER diagram, you can use it to better understand and update an existing database or plan a new one.
What is an EER diagram?
EER diagram, or EERD, stands for enhanced entity-relationship diagram. Essentially, it includes everything that an ER diagram does, but it allows you to include more detail.
In an EERD, you can include information to help you generalize, specialize, and aggregate the data. You do this by including inheritance hierarchies. In other words, if you have a parent entity and a child entity, the child entity can inherit characteristics of the parent entity.
For example, say you have an employee database at a hospital. The parent entity could be medical staff, which includes attributes like employee ID and the date they began working at the hospital. The child entities could include doctors and nurses, which would inherit those same attributes.
In this example, the parent entity is a generalized category, while the child entities are specialized entities. Creating this inheritance hierarchy reflects the true nature of the hospital data, eliminates redundancies, and makes the database design more consistent.
You can similarly include more complex information by creating categories. This feature of an EER diagram allows you to divide an entity into subtypes based on specific attributes. This further allows you to specialize your data.
When to use an ER diagram vs an EER diagram
ER and EER diagrams are similar. In a lot of situations, you could use either type, and it would do the job for you. However, in other times you may be better off if you intentionally choose one or the other.
If you're diagramming a simple system or just giving a high-level overview, an ER diagram is your best bet. It will cover all the information you need cleanly and simply so that you can see the whole database structure at once.
However, if you're modeling something more complex, an EER diagram has more advantages. They're significantly better at capturing complicated relationships between entities, thanks to their use of inheritance hierarchies, category subtypes, and relationship attributes. If you use an EER diagram, you're more likely to create something that both expresses your data more fully and has better data integrity as a whole.
Dive deeper into the different types of entity relationship diagrams.
Learn moreLimitations of ER and EER diagrams
Whether you choose an ERD or EERD, you'll reap many benefits as you map out your system. However, while we've focused on what these diagrams do well, we have not yet discussed what they do poorly.
ER and EER diagrams are really only useful for relational, structured data. If you're working with a non-relational database or unstructured data that isn't delineated into different fields, rows, or columns, these models will do you little good—it’s just not what they're for.
How Lucidchart can help
Lucidchart is a powerful tool that can help you easily create your own ER or EER diagrams.
Access standard shapes and important database tables and schemas to customize your diagram to your needs. Or, save hours of manual work with our ERD import feature.
We also offer templates to give you a head start on your diagram. Lucidchart offers hundreds of templates, so no matter what you're looking for, we probably have something to help you get started–browse our template library to see what will fit your needs best.
Whether you're designing a database from scratch or simply trying to better understand the one you have, an ER diagram or EER diagram can be a useful tool. Use it to see the bigger picture of what's going on, and let Lucidchart do the heavy lifting so you can focus on the work that's most important to you.

Ready to try it out for yourself? We’ll walk you through exactly how to create an ERD in Lucidchart.
Get startedAbout Lucidchart
Lucidchart, a cloud-based intelligent diagramming application, is a core component of Lucid Software's Visual Collaboration Suite. This intuitive, cloud-based solution empowers teams to collaborate in real-time to build flowcharts, mockups, UML diagrams, customer journey maps, and more. Lucidchart propels teams forward to build the future faster. Lucid is proud to serve top businesses around the world, including customers such as Google, GE, and NBC Universal, and 99% of the Fortune 500. Lucid partners with industry leaders, including Google, Atlassian, and Microsoft. Since its founding, Lucid has received numerous awards for its products, business, and workplace culture. For more information, visit lucidchart.com.
Related articles
What is an entity relationship diagram?
Learn the essentials of ER diagrams and ER models, including their origins, uses, examples, components, limitations, and guidelines on how to draw them.
A quick guide to different types of entity relationship diagrams
An entity relationship diagram (ERD) is a diagram that helps you to see how different entities relate to each other in a system. Learn about different types in this quick guide.
What is intelligent diagramming?
Intelligent diagramming refers to both a more intelligent way to diagram, as well as to the diagrams themselves, which are more intelligent and interactive.
Creating basic diagrams in Lucidchart [+ course]
In this article, we’ll cover the basics of Lucidchart and give you tips to build dynamic diagrams that clarify complex business processes.
Bring your bright ideas to life.


By registering, you agree to our Terms of Service and you acknowledge that you have read and understand our Privacy Policy.