
How to use swimlanes to improve project management
Reading time: about 5 min
When you go to a swim meet, the pool is divided into lanes. Each lane is assigned to individuals or teams depending on what type of events are being run. This allows several swimmers to swim simultaneously without bumping into each other.
You can find this same concept of swimlanes in project management. Individuals, teams, or departments are assigned specific tasks that help the company to reach their goals. Many of these tasks are worked on simultaneously, much like a pool. By dividing these tasks into separate “lanes,” you have a better understanding of how work flows across departments and roles. You also gain insight and clarity about who is doing what and what individual responsibilities are.
In this article, we’ll discuss what swimlane diagrams are, how to draw and use them, and how using swimlane diagrams can improve your project management processes overall.
What is a swimlane diagram in project management?
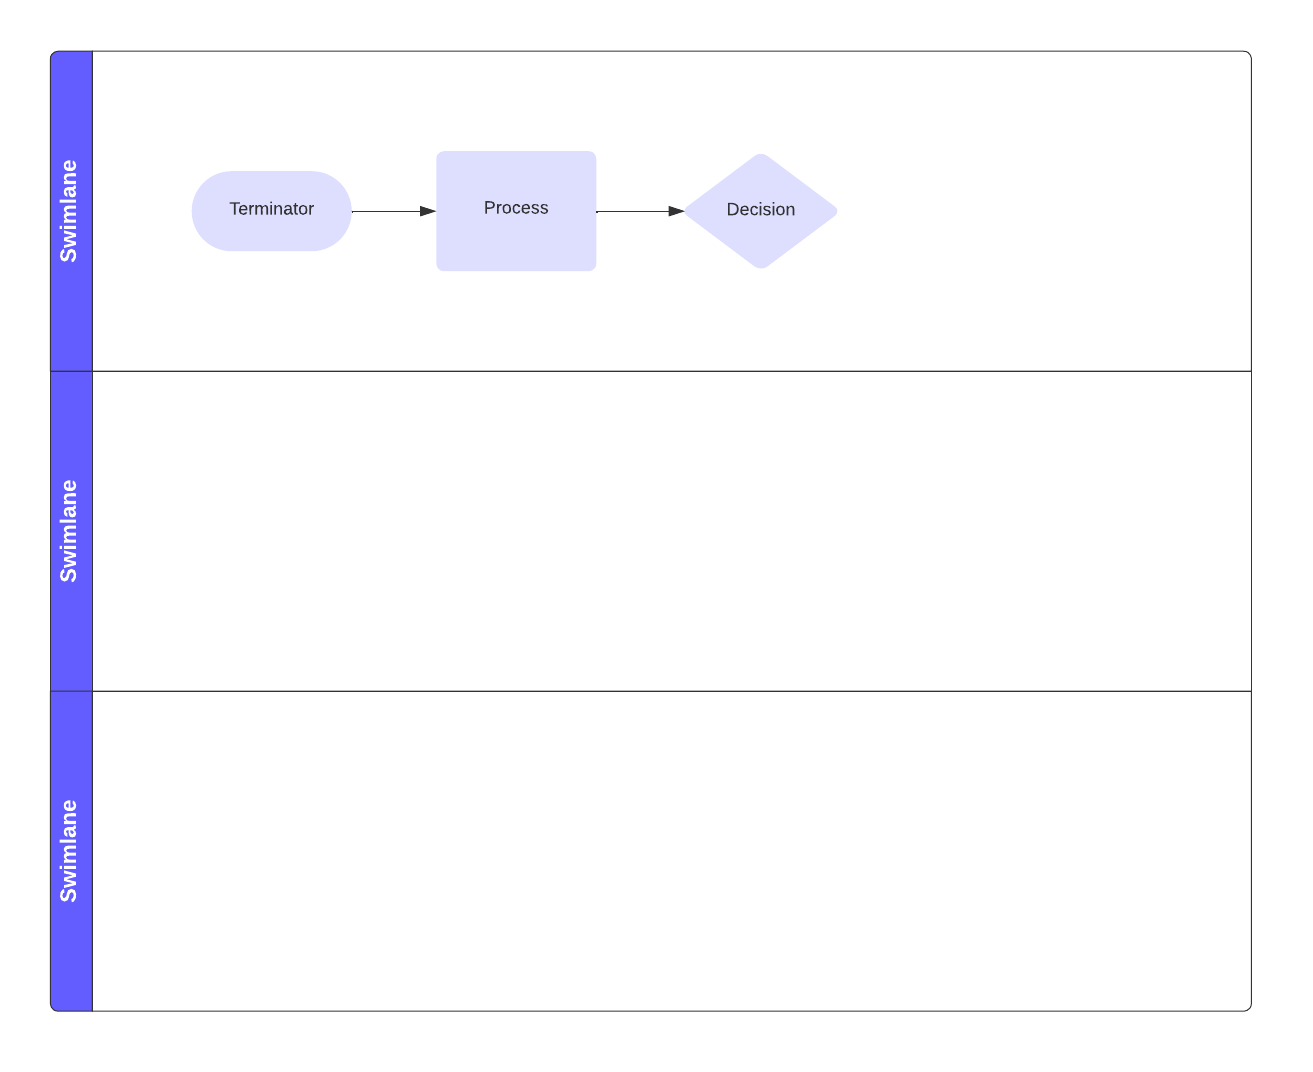
A swimlane diagram in project management is a type of flowchart that divides work into several “lanes.” Each lane is assigned to individuals, teams, departments, or roles. The work in each lane is broken down into the specific steps that need to be done by the people assigned to the lanes. You can use Business Process Model and Notation (BPMN) shapes and lines to visualize the steps involved in each task, process, or sub-process.
Each swimlane in the diagram gives you a visual overview of a business process from beginning to end. This helps you to understand who is responsible for what and how all the work connects across the different lanes and fits in the overall project, making it much easier to manage large, complex projects.
Swimlanes helps not only you but also everybody involved in the project across the entire company understand how the different parts of your organization fit together. Understanding each other’s roles and responsibilities helps you identify inefficiencies, bottlenecks, redundancies, and waste so you can more easily find solutions for improvement to keep your processes running smoothly.
Looking for a more in-depth explanation and history of swimlane diagrams? We’ve got you covered.
Go nowHow can swimlanes help you improve your project management processes?
Using swimlane diagrams can help you in the following ways:
-
Boosted clarity: The visualization of individual and team responsibilities within the project helps you to see who is responsible and accountable for each task clearly. This helps to reduce confusion and redundancy across departments and divisions in your organization.
-
Increased understanding of processes: Visually mapping processes in swimlane diagrams gives you a deeper understanding of how the work flows across the entire organization. This can help you see potential bottlenecks, inefficiencies, redundancies, and other areas needing improvement.
-
Strengthened communication: Swimlanes can facilitate communication among various teams across your organization. This increased communication makes it easier to keep everybody involved aligned and focused on the same goals.
-
Better change management: You can always expect that there will be changes. Swimlane diagrams help you determine and communicate the impact a change might have on various teams and individuals involved in the project. That way, you can make a plan to implement change with minimal impact.
-
Increased collaboration: Making the swimlane diagrams available to everybody working on the project can increase collaboration as teams understand how their work interacts with or depends on work from other organizations. Everybody involved can analyze process flow, make suggestions for improvement, and work together to streamline processes and improve efficiency.
-
Improved documentation: Swimlane diagrams are a single source of truth that documents project processes. If it’s not documented in the diagram, then it doesn’t belong in the project. You can use these diagrams during reviews and audits, and when hiring new employees to aid with orientation and training.
What is the difference between a flowchart and a swimlane diagram?
As we’ve mentioned, a swimlane diagram is a type of flowchart. Swimlanes and flowcharts are used to describe steps, activities, inputs, outputs, and decision paths in a process. But there are a few differences:
-
Flowcharts: These diagrams focus on the logical flow of what needs to be done in a process. They do not define who is responsible for completing each task in the process.
-
Swimlane diagrams: These diagrams focus on who performs each task or action in a process. The process steps are placed within horizontal or vertical swimlanes that are assigned to the people who will do the work. This enhances clarity and accountability and helps prevent things from falling through the cracks or being overlooked.
It doesn’t matter if your swimlanes are drawn horizontally or vertically. But to reduce confusion and to be consistent, once you decide on horizontal or vertical swimlanes, all swimlanes should be drawn using the same orientation. There is also no limitation to how many swimlanes you can use. Draw as many or as few as you need to document all the process steps that need to be done to complete your project.
Lucidchart swimlane templates
Lucidchart makes it easy to draw, share, and collaborate on swimlane diagrams. Lucidchart brings together dispersed and hybrid teams to collaborate on the same document in real time no matter where your team members are located in the world. Plus, enjoy dozens of features, shapes, lines, colors, and templates you need to get started quickly.
How to create a swimlane diagram in Lucidchart
Creating a swimlane diagram in Lucidchart is easy. If you are using one of the example swimlane templates, simply edit the existing text and use the shapes library to add lanes, shapes, lines, and colors you want to describe the flow of your process. Or, drag and drop shapes and symbols to represent your process flow, making connections along the way.
Explore all the ways Lucid makes project management easier with swimlanes.
Learn moreAbout Lucidchart
Lucidchart, a cloud-based intelligent diagramming application, is a core component of Lucid Software's Visual Collaboration Suite. This intuitive, cloud-based solution empowers teams to collaborate in real-time to build flowcharts, mockups, UML diagrams, customer journey maps, and more. Lucidchart propels teams forward to build the future faster. Lucid is proud to serve top businesses around the world, including customers such as Google, GE, and NBC Universal, and 99% of the Fortune 500. Lucid partners with industry leaders, including Google, Atlassian, and Microsoft. Since its founding, Lucid has received numerous awards for its products, business, and workplace culture. For more information, visit lucidchart.com.
Related articles
Lucidchart flowchart templates and examples
As you may have noticed from user stories on our blog and our creative flowcharts, you can build a flowchart for just about any purpose to visualize any idea or process. Get started with these flowchart templates and examples!
What kind of flowchart should you use?
Flowcharts are relatively flexible and adaptable, and many types share common characteristics. This blog will help you identify the right flowchart type for your use, is ensuring that your flowchart offers the full range of functionality and visualization complexity you need.
The 4 phases of the project management life cycle
Learn about the 4 phases of the project management life cycle. Whether you’re working on a small project or a large, multi-departmental initiative, you can apply our tips to successfully take your projects from initiation to close.
Is your project management workflow process broken?
A smooth project management workflow can make or break your team. Learn how effective your current process is and how you can use Lucidchart to improve it.
Bring your bright ideas to life.
or continue with


By registering, you agree to our Terms of Service and you acknowledge that you have read and understand our Privacy Policy.