How to Make a Flowchart in PowerPoint
Lucid Content
Reading time: about 9 min
Topics:
It’s T-37 minutes until your big presentation, and you’re still scrambling to get your flowchart to look right in PowerPoint. You’d scrap the flowchart slide all together, but unfortunately it’s the crux of your whole presentation. With every tick of your watch, selling everything you own and traveling to Cambodia to live as a Buddhist monk sounds more and more appealing. At least you won’t make a fool of yourself in front of your boss, your co-workers, and pretty much the whole world.

If this is you or ever has been you, never fear! We’re here to save your bacon. There’s a reason why you’re struggling to get your flowchart to look right in PowerPoint—PowerPoint wasn’t designed to build flowcharts. We want to make sure you know there is a better option out there that will simplify your task and provide exceptional results. It’s called Lucidchart.
Unlike PowerPoint, Lucidchart was designed for building flowcharts and diagrams. We understand the importance of visual thinking and communication, so we’ve built a platform that can help you do both without spending hours battling inefficient software. And the best part? It’s completely free! Take a minute to sign up and try it out.
If you’re determined to subjugate your unruly PowerPoint flowchart, we’ve provided a guide that should help you out, but if you’re interested in saving time and creating a more professional visual, you can easily build your flowchart in Lucidchart.
It’s up to you: test your mental endurance as you work down to the wire in PowerPoint, or take a nap, get a snack, whip up a stunning flowchart in Lucidchart, and then walk into your presentation with absolute confidence. You decide.
Make a flowchart in PowerPoint
1. Set up a grid
Before you start drawing shapes on your slide, take a minute to prepare your virtual workspace by adding a grid. Grids can assist you in aligning shapes and creating consistent dimensions for each object. To set up a grid:
- Select the View tab and click the Gridlines checkbox.
- Edit your grid by selecting the arrow icon in the corner beneath the Gridlines checkbox to get to the Grid Settings menu.
- Enable useful features like “Snap objects to grid” and “Display smart guides when shapes are aligned.”

2. Add shapes
Now you’re ready to start building out your flowchart. As you do so, there are two types of shapes you may find useful: basic Shapes and SmartArt graphics. Shapes are individual objects that you can insert into a slide and edit as necessary. SmartArt graphics are premade collections of shapes.
To add Shapes:
- Click the Insert tab and select Shapes.
- Click to choose your desired shape from the gallery that appears, click on the canvas, and drag your mouse to draw the shape.
- Repeat this process to draw more shapes and connecting lines until you’ve created your flowchart.

To add SmartArt graphics:
- Click the Insert tab and select SmartArt.
- From the dialog that appears, choose the SmartArt option you want to use, then click OK. For flowchart shapes, look under the Process category in the left panel of the dialog.
- To replace your graphic, select it and press Delete. Then re-open the SmartArt dialog (Insert > SmartArt) and choose a different graphic.
- To change the layout of a graphic, select it and click Design > Layout to pick another style. Chart layout can be edited without losing any text.
- Continue to add shapes and connect them with lines until your flowchart is ready.

Note that some SmartArt graphics don’t support unlimited shape addition. For those that do, select the shape nearest to where you want to add a new shape, or select the entire chart, depending on which type of chart you’ve inserted. Click the Design tab and choose “Add a Shape.”
3. Add text
Make your flowchart self-explanatory by adding text labels to your shapes, lines, and icons.
- To add text to a SmartArt graphic, click on the filler text and begin typing. The text boxes will automatically resize as you type.
- To add text inside a Shape, double-click the Shape and start typing.
- If a shape doesn’t support text insertion, you can manually add a text box by selecting Insert > Text Box.

4. Style shapes and lines
You can make basic edits to your Shapes and SmartArt graphics by right-clicking on an object and using the menu that appears. For a comprehensive menu of editing and styling choices, click a shape or SmartArt graphic, then use the Format and Design tabs that appear in the ribbon. Note that the Design tab will only appear for SmartArt graphics and not for Shapes.
Using the abbreviated menu on the canvas or the comprehensive menu in the ribbon, you can:
- Choose how to wrap text.
- Send an item to the front or back of another shape.
- Style, fill, or outline a shape.
- Resize font and choose a customized font type.
To move a shape or line, click on it and drag. Resize by dragging from an edge or corner, or rotate a shape by clicking and dragging the handle icon.

You can move or format multiple objects at once. Click on a shape, press the Shift key, and select the remaining shapes by clicking on them. Alternatively, click and drag your mouse around each shape you want to select. Once the objects are selected, you can move them with arrow keys or your mouse. You can also add formatting, such as a different color fill, and it will apply to the entire selection of shapes. Deselect by clicking on another part of the page.
Make a flowchart in Lucidchart
Compared to PowerPoint, Lucidchart is a far superior option for making flowcharts. Elements intuitively snap to each other, and publishing or sharing takes a single click. If you’d like to include a flowchart in a slideshow, simply build it in Lucidchart and then insert it as an image or embed it as an interactive diagram using our seamless integration.
1. Sign up for a free account
If you haven’t already created a free Lucidchart account, do so now.
Sign up free2. Add shapes
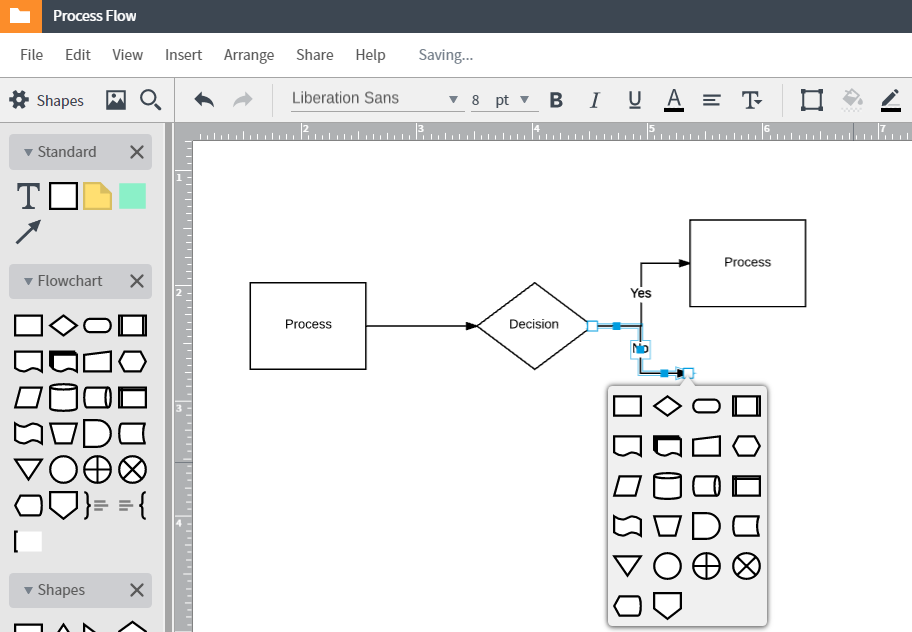
First, make sure you have the correct shape libraries open by clicking “+ Shapes” in the left toolbar or by hitting the “M” key. Select the shape libraries you want to use, then press “Save.”
When you’re ready to build your flowchart, it’s as easy as 1-2-3:
- Drag a shape from the toolbox on the left and drop it onto the canvas.
- Hover along the border of an object. When crosshairs appear, click and drag to draw a line.
- As you release the mouse, you’ll be prompted to add the next shape.

That’s it! Easy peasy. You can also draw lines by right-clicking and choosing Draw Line, or pressing L on your keyboard.
3. Add text
To add text, double-click on a shape and start typing. You can also create a text box by dragging the “T” icon from the toolbox and placing it on the canvas.
Add text to any part of a line by double-clicking and typing on the line.

4. Style shapes and lines
Add a personal touch to your diagram with a splash of color and other visual effects. All of the controls to modify color, font, lines, and arrows are found at the top of the editor.

Right-click on a shape to access additional options such as moving a shape forward or backward, changing a shape, or turning it into a hotspot.
You can edit and move multiple shapes simultaneously by holding Shift as you select each object.
5. Optional: Add to PowerPoint
If you’re trying to put your flowchart into a presentation, leverage our download options or Microsoft integration to quickly insert your Lucidchart documents into PowerPoint.
Download an image of your flowchart by selecting File > Download As. Select the preferred file type and click “Download.” Insert into your PowerPoint as a regular image.

Alternatively, download the Lucidchart add-in for PowerPoint. It’s completely free and only takes a moment to set up. Click on the button below, select “Add,” and follow the instructions.
Get the add-inOnce the integration is complete, the Lucidchart add-in will be open in PowerPoint and ready to use. With the add-in, you can insert interactive diagrams that you can scroll through and interact with during a presentation.
Useful features in Lucidchart
Lucidchart has a variety of helpful features that aren’t available in PowerPoint or other diagramming programs. Instead of taking multiple clicks to insert shapes, Lucidchart lets you quickly drag and drop shapes onto the canvas where they instantly snap together. You can even add interactive links and layers to impress your audience.
Lucidchart makes it easy to align flowchart symbols, apply coordinated styling, and share your flowcharts across print and digital media. Use our Flowchart PowerPoint template to get started! And let us know how it goes. We’d love to hear from you in the comments below!
About Lucidchart
Lucidchart, a cloud-based intelligent diagramming application, is a core component of Lucid Software's Visual Collaboration Suite. This intuitive, cloud-based solution empowers teams to collaborate in real-time to build flowcharts, mockups, UML diagrams, customer journey maps, and more. Lucidchart propels teams forward to build the future faster. Lucid is proud to serve top businesses around the world, including customers such as Google, GE, and NBC Universal, and 99% of the Fortune 500. Lucid partners with industry leaders, including Google, Atlassian, and Microsoft. Since its founding, Lucid has received numerous awards for its products, business, and workplace culture. For more information, visit lucidchart.com.
