How BAs Can Use a Decision Matrix to Make Tough Choices
Lucid Content
Reading time: about 6 min
Topics:
As a business analyst, you have to make a lot of important decisions. From strategic planning to policy evaluation to process modeling, your choices are often complex and have a direct impact on the business.
With so much at stake (and so many factors to consider), how can you know if you’re making the best choice?
A decision matrix can help.
What is a decision matrix?
A decision matrix is a tool that helps business analysts and other stakeholders evaluate their options with greater clarity and objectivity. A decision matrix (or grid) can:
- Reduce decision fatigue.
- Reduce subjectivity in decision making.
- Clarify and prioritize options.
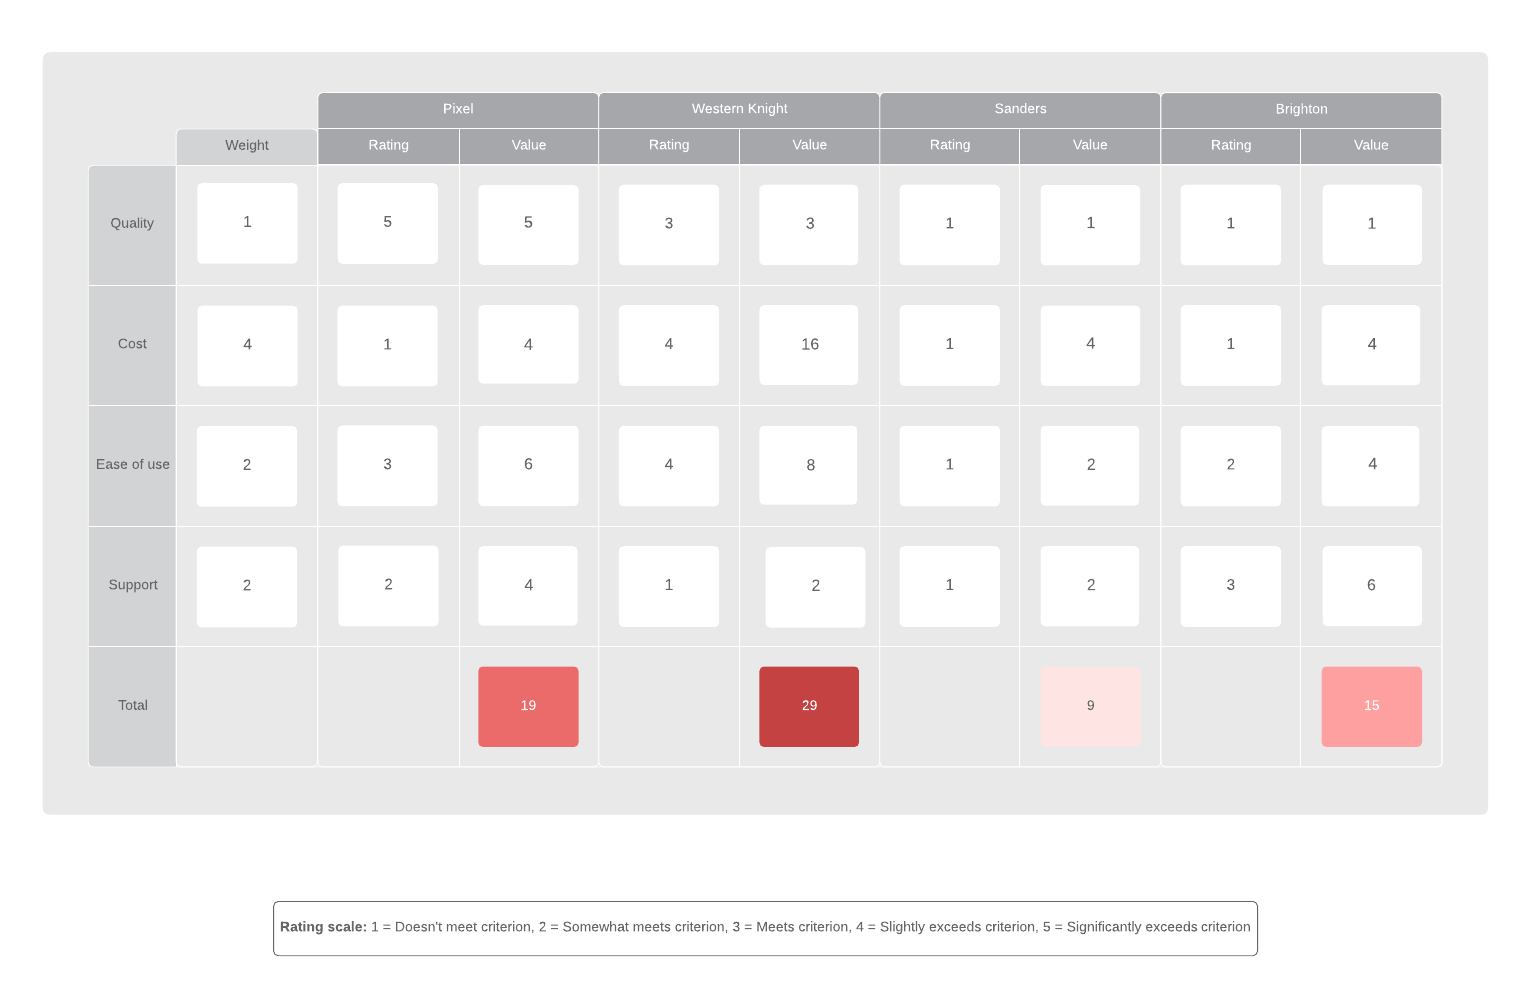
Decision-making grids outline the criteria for making a decision and rank them based on the most important factors. These grids provide analysts with a measurable method for evaluating their options systematically.
The decision matrix is also known by other names, including:
- Pugh matrix
- Decision grid
- Opportunity analysis
- Multi-attribute utility theory
- Grid analysis
- Problem selection matrix
- Criteria rating form
- Problem selection matrix
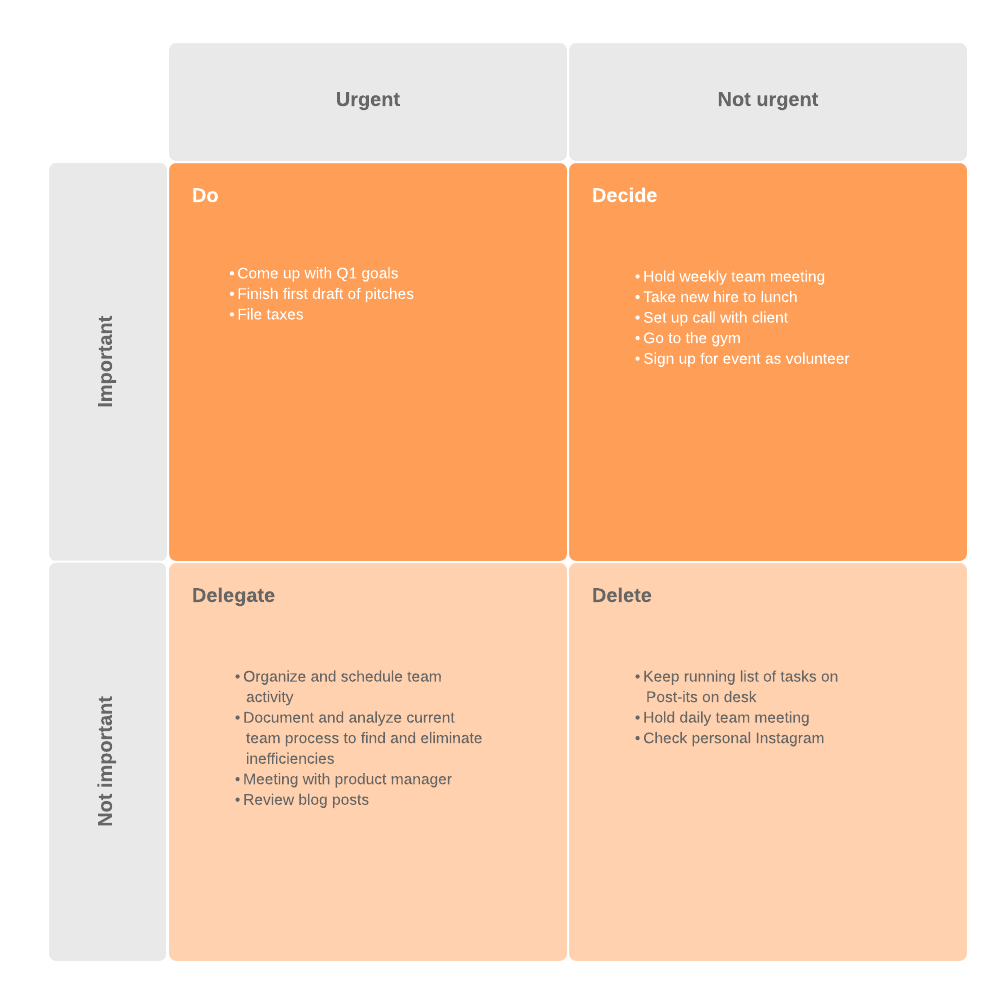
Another type of decision-making matrix is the Eisenhower matrix, but it focuses on identifying and ranking personal priorities, rather than major business decisions. Although some basic calculations are involved, the concept and application are fairly simple and straightforward.
When to use a decision matrix
The nice thing about the decision matrix is that it can apply to many different types of decisions. However, it is most effective when you or your team is comparing multiple options or criteria that need to be narrowed down to one final choice.
It’s a common solution for business analysts as well as project managers, business leaders, designers, and other stakeholders who have to juggle multiple opportunities with complex criteria and requirements.
How to make a decision matrix
The beauty of the decision matrix is how simple it is to create. You can create a decision matrix by hand on a piece of paper, a whiteboard, or on a spreadsheet. There are also online template solutions available.
Lucidchart’s ready-made decision matrix template can help you get started right away. With rich features like data linking and conditional formatting, you can customize your templates to help you identify the best solution faster.
The decision matrix is organized into a table of rows and columns. The rows list out the potential options and the columns outline the various factors or decision making criteria to consider.
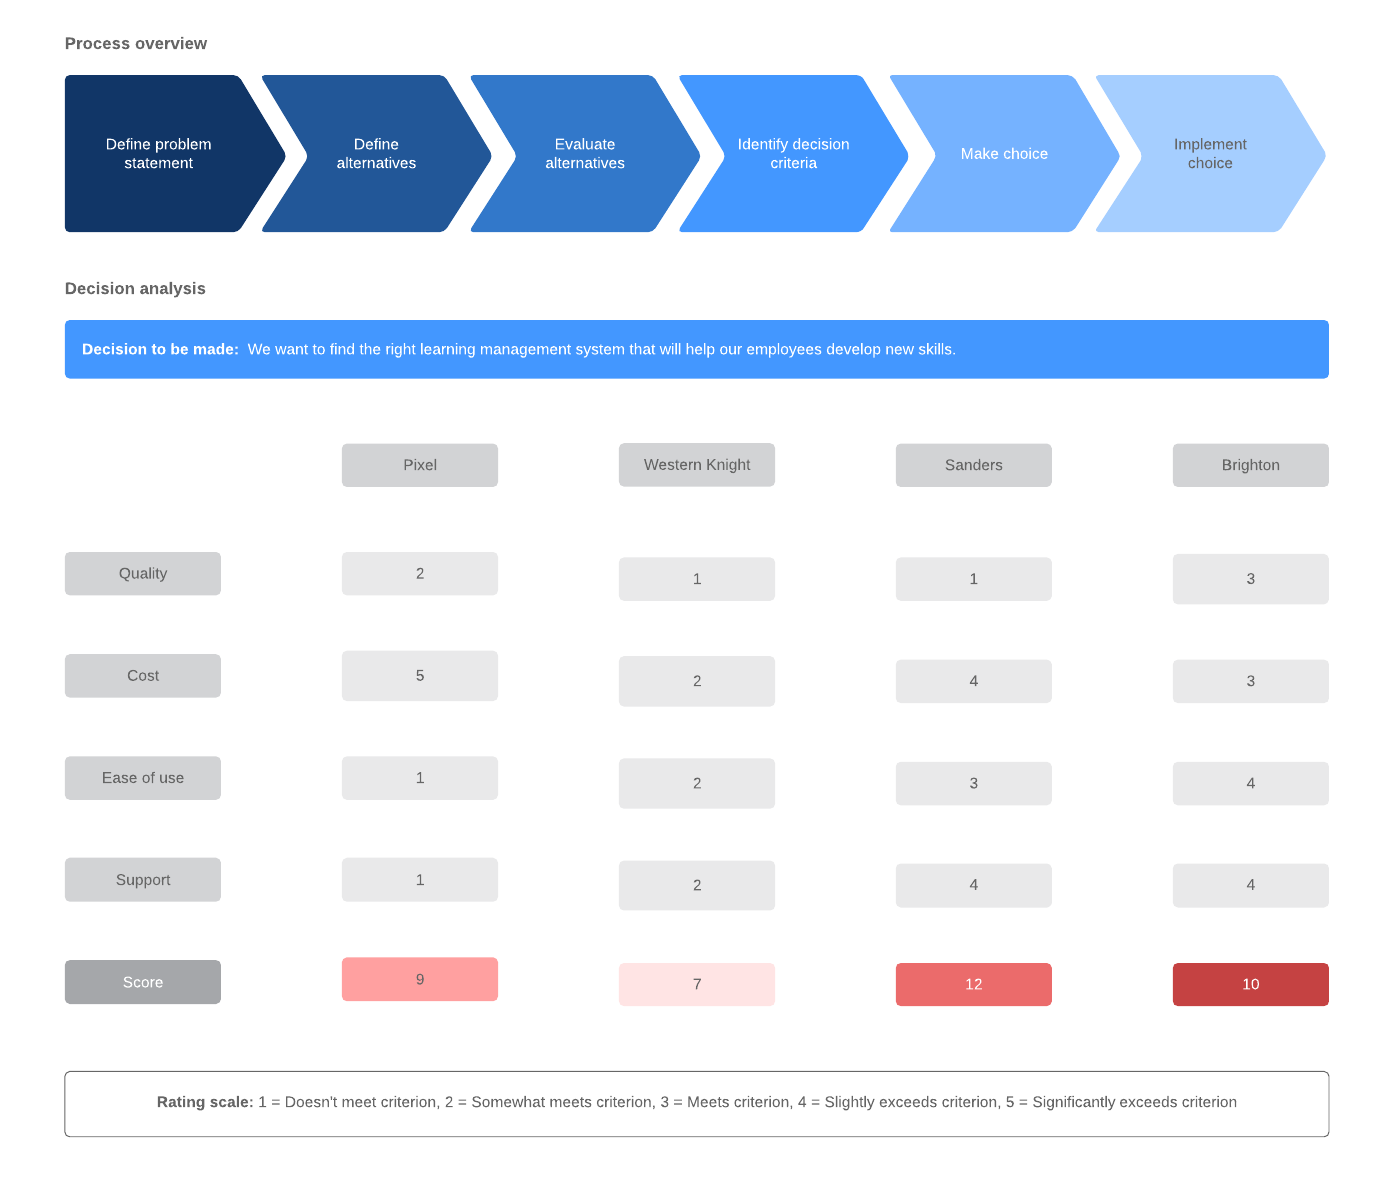
Conducting a step-by-step decision making analysis
We’ll use a simple decision to illustrate how a basic decision matrix works. Let’s say you want to take your team out to a restaurant to celebrate a victory. A decision matrix can help you choose where to go.
1. Create the matrix table
The first step is to create your matrix. As noted earlier, the table will be organized into rows of options and columns of criteria. Fill out the rows with the various options you are considering. For this example, your options might be:
- Fancy New York steakhouse
- Elegant Italian cuisine
- Funky Mexican eatery
- Interactive Japanese restaurant
Next, you will identify the criteria you will use to evaluate them.
2. Brainstorm criteria
With your table and options outlined, you can now brainstorm what factors or criteria you will use. Common criteria for business decisions include:
- Cost
- Return on investment
- Buy-in (from team or customers)
- Impact on other systems
- Needed resources (time, money, people)
- Ease of implementation
- Value to customer
- Potential problems or negative consequences
- Urgency of the problem
If applicable, involve customers or other stakeholders to help you narrow the list of evaluative criteria to only the most important.
As you deliberate, identify which attributes the final decision must have. This will help you eliminate choices early on that don’t fit your requirements.
For our example, you might consider the following criteria or requirements:
- Food allergy accommodations
- Cost
- Entertainment
- Team preferences
- Distance from office
3. Evaluate and rank criteria
Now you will evaluate your decision making criteria against the options. In other words, you will score how well each criterion is met under each option. There are a few ways to do this:
Method 1: Rate criteria on a scale (typically 1-3 or 1-5). The higher the number, the better that criterion matches the option.
Method 2: Rank-order the options across the criteria. For each criterion, rank your options based on how well they each meet the requirement (1 being low or least desirable).
Method 3: Use the Pugh matrix method and compare your options against a baseline. Your baseline can either be one of the options under consideration or it can be the existing solution your team or company is using and planning to replace. For each criterion, rate the option against the baseline as worse (-1), same (0), or better (+1).
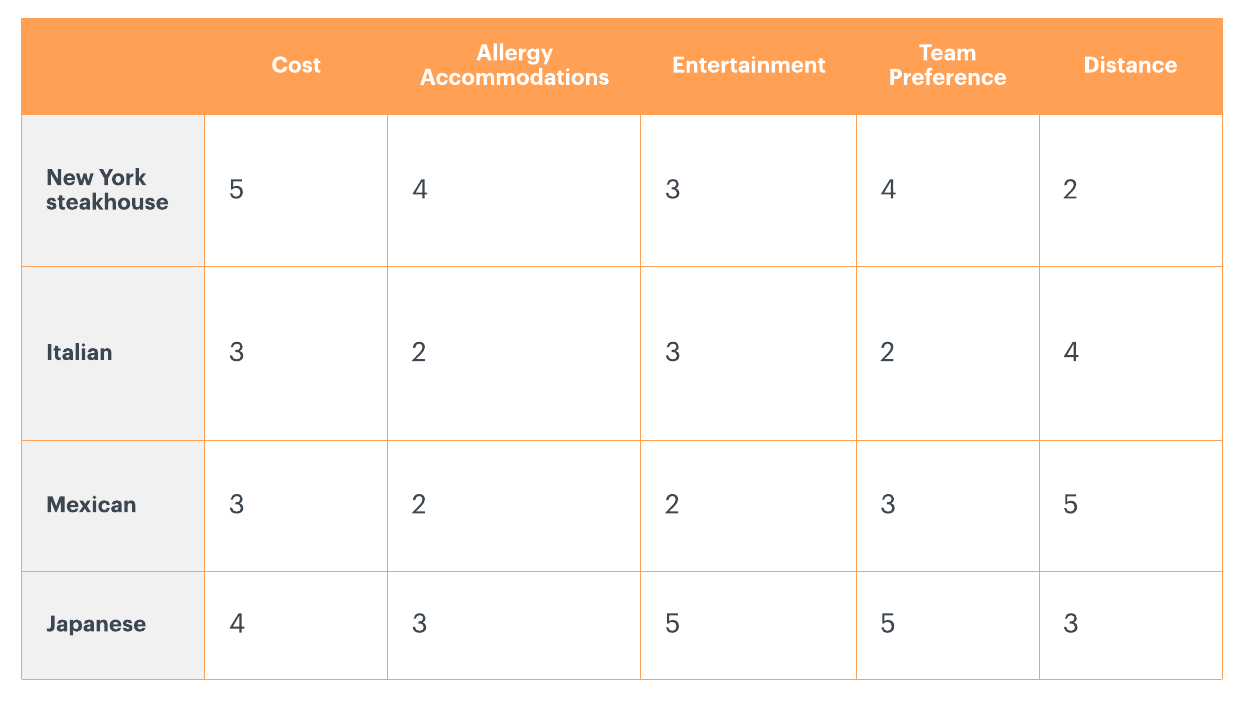
To apply the Pugh matrix method to the restaurant example, let’s say the rankings break down something like this:
4. Weight the criteria
Although you have your options ranked by criteria, not all criteria will have the same level of priority. For example, if you have a strict budget constraint, cost may be more important than other criteria on the table.
To measure this difference in priority, you will need to weigh the requirements from least to most important. It’s easiest to use the same scale as you did to rank the options.
5. Score your options
Finally, it’s time to score your options to identify which decision to make.
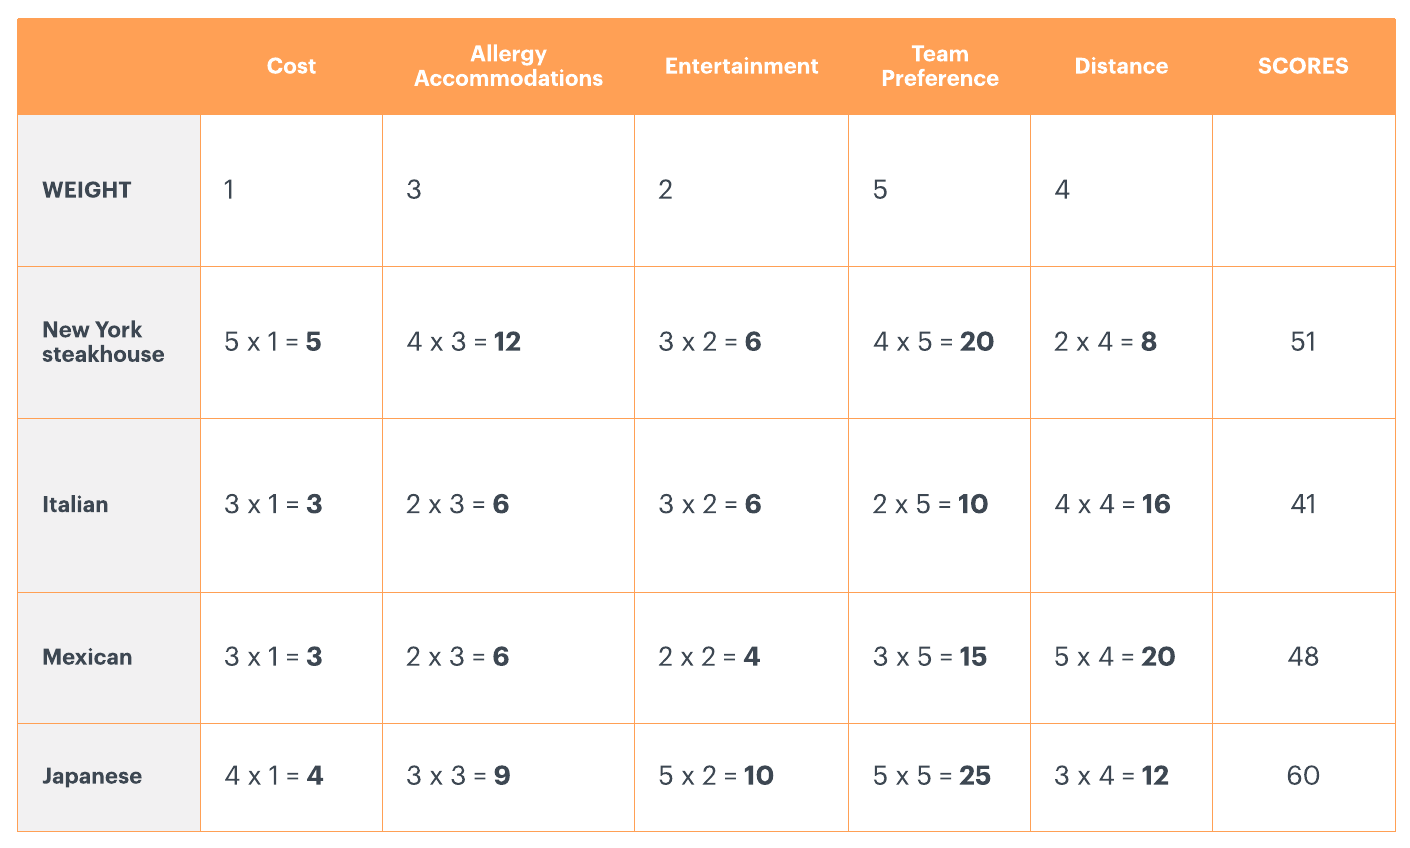
To calculate each option’s final score, simply multiply each option’s rank by each criterion’s weight. For instance, if you had Cost as a criterion weighted at 5 and Option A had a rank of 2 for that criterion, you would multiply 5 times 2 to get 10.
You repeat this process for each option across every criterion. Once each box has a score, you tally up each row for a final rank of each option.
In our example, after multiplying each option against the weights of your criterion, the winning score is the Japanese restaurant.
Of course, this is an example of a simple decision, but decision matrices work just as well for more complex problems and solutions.
Next time you’re faced with a mental quagmire, pull out your decision grid and start calculating. With careful consideration and basic math skills, you can find the clarity and confidence you need to move forward on decisions big and small.
Get started in LucidchartAbout Lucidchart
Lucidchart, a cloud-based intelligent diagramming application, is a core component of Lucid Software's Visual Collaboration Suite. This intuitive, cloud-based solution empowers teams to collaborate in real-time to build flowcharts, mockups, UML diagrams, customer journey maps, and more. Lucidchart propels teams forward to build the future faster. Lucid is proud to serve top businesses around the world, including customers such as Google, GE, and NBC Universal, and 99% of the Fortune 500. Lucid partners with industry leaders, including Google, Atlassian, and Microsoft. Since its founding, Lucid has received numerous awards for its products, business, and workplace culture. For more information, visit lucidchart.com.
Related articles
How to make a decision: Exploring 3 decision-making methods
The next time you need to make an important business decision, how will you approach the process? That's an important decision in itself. Learn 3 key decision-making techniques to determine the best move for your company.
How to make a decision tree in Word
With our diagramming software, it’s easy to learn how to make a tree diagram in Word. Drawings in Word can get messy, but our diagramming tool includes templates, intuitive features, and Microsoft integrations to help you easily build your diagram and insert it.

