
Next-gen diagramming: The difference between good vs. great diagramming software
Reading time: about 7 min
Topics:
Whenever we settle for “good enough” solutions in life, there’s a tradeoff. Sure, the cheaper, good enough dishwasher may clean your dishes, but it’ll use twice as much energy and leave your dishes streaky.
In business, the tradeoff of settling for “good enough” technology is far greater than a few streaky dishes. For example, tons of basic diagramming solutions are available on the market, many of which, at first glance, may seem “good enough.” But these solutions compromise key functionality, such as precision, real-time collaboration features, dynamic visuals, and flexibility.
Just as the good enough dishwasher creates extra work and costs for you in the long run, the good enough diagramming solution does, too—often in the form of steep learning curves, limited automation, and inefficient collaboration experiences.
To work efficiently, make smart decisions, and innovate, you can’t settle for anything less than a modern, intelligent diagramming solution—what we refer to as next-generation diagramming. In this blog post, we’ll uncover the key qualities that distinguish a run-of-the-mill diagramming platform from the next-gen diagramming solutions that will set your business apart.
What makes a diagramming solution great
All diagramming solutions offer basic shapes, lines, and arrows. So, what exactly differentiates these good enough diagramming solutions from great ones?
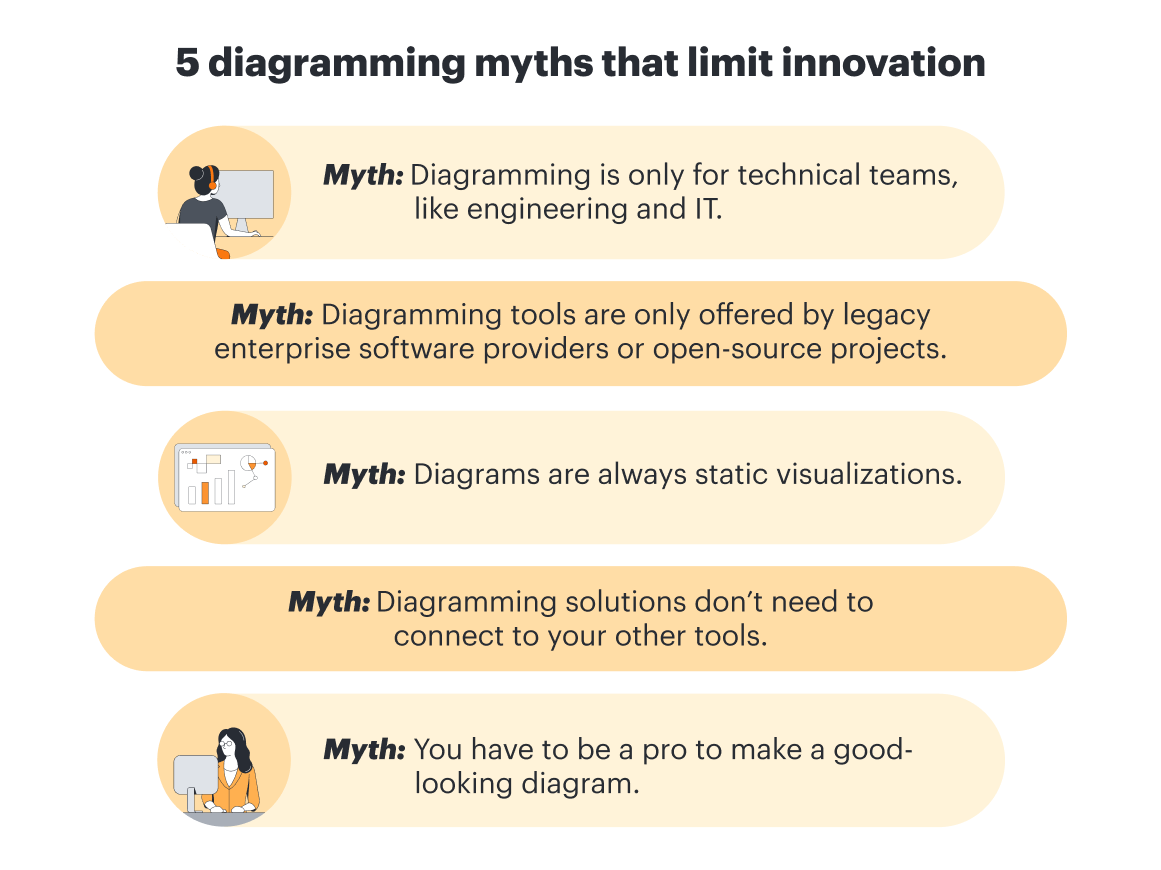
With such a saturated market—and many misconceptions around diagramming—it’s not always easy to identify the best solutions. In this post, we’ll bust some of the most common diagramming myths and reveal what capabilities actually make up next-gen diagramming.
It’s consistently updated and improved
If your diagramming solution looks roughly the same as it did years ago, you’ve got a problem. Take, for instance, Microsoft Visio, which hasn’t released new features since 2021. While many may think the software that’s been around since the ‘90s would be the most advanced, this is far from the truth.
Even as the workplace has recognized the need for real-time collaboration, Visio still has limited collaboration functionality. It requires users to have the same version of Visio (desktop or web app) to collaborate on diagrams simultaneously.

Uncover eight reasons why you should switch from Visio to Lucidchart.
Learn moreA next-gen diagramming solution will incorporate new functionality, such as automation and AI, to meet the changing needs of modern business.
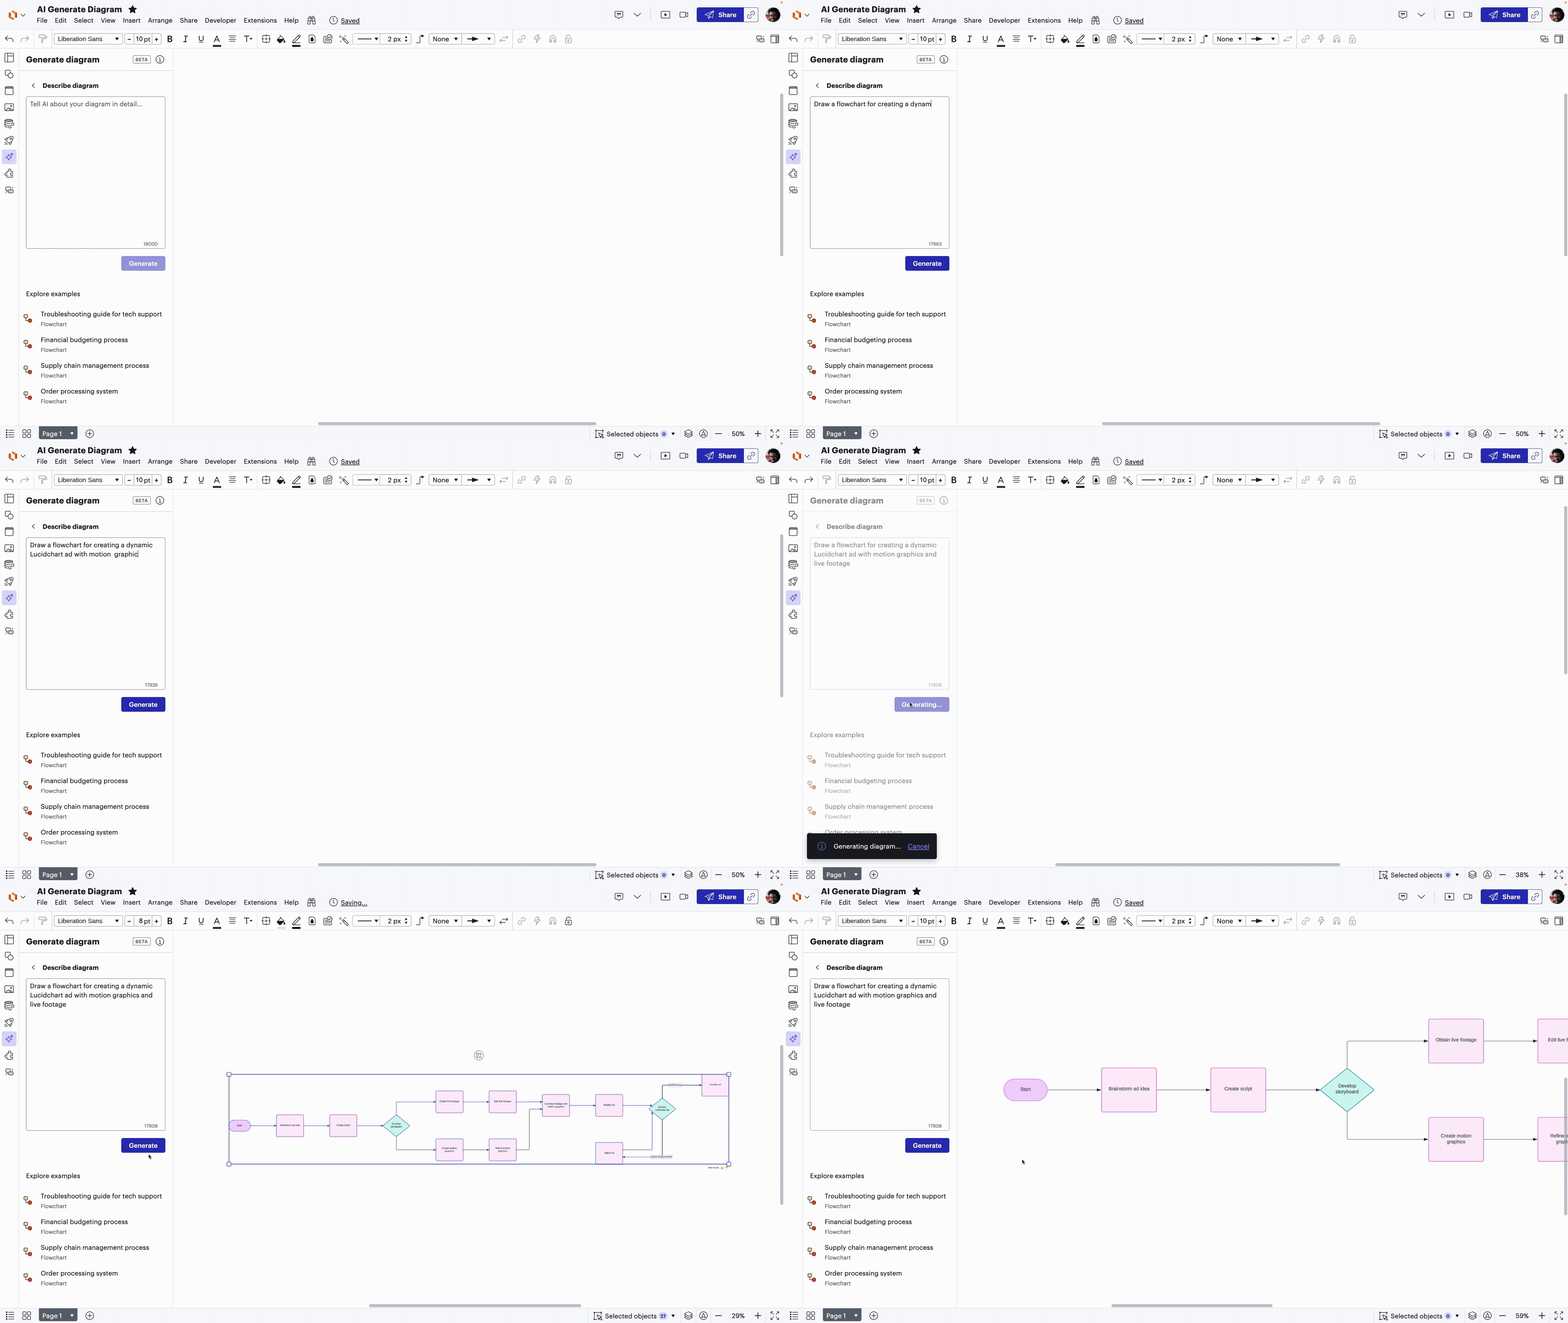
We can use Lucidchart as an example of what it means to adapt to the times. Lucidchart is continually innovating new features and functionality (even after being around for 12+ years). Recently, Lucidchart released updates to help users create diagrams faster than ever. With quick diagramming, you can update, add, and connect shapes in your diagrams in just a few clicks. Or, use Lucid's AI features to automatically generate a diagram based on a prompt of your choosing (and keep iterating on your diagram). You can also use Lucid Custom GPT to auto-generate editable diagrams based on prompts in ChatGPT+.
It makes it easy to create professional-looking diagrams
Although some diagramming solutions may make you think otherwise, you shouldn’t have to be a pro to make a good-looking diagram. Next-gen diagramming solutions are intuitive, meaning that any user—both first-time and seasoned diagrammers—can easily create professional diagrams.
Lucidchart, for example, contains 1100+ templates to make it easy to create any diagram, from process maps to UI designs and technical architecture diagrams. To polish your diagram further, Lucid offers assisted layout, a set of features that intuitively arranges shapes and lines automatically so your document looks professional and polished without manual tweaking.

Shortcuts to create professional diagrams
See all the ways you can quickly make impressive diagrams in Lucidchart.
Go nowIt’s accessible across the entire organization
There’s a common misconception that diagramming is only for technical teams like engineering or IT. Unfortunately, organizations that view diagramming through this narrow lens will miss out on key opportunities to improve efficiency and gain deeper insights into every part of the business.
Let’s look at HR teams as an example. While they may not be diagramming as frequently as their engineering counterparts, they will still need to create and update org charts or map out cross-functional hiring or onboarding workflows.
The problem is that many “good enough” diagramming solutions on the market today make you choose between a not-so-user-friendly platform that supports highly technical use cases or an easy-to-use platform that appeals to non-technical teams but lacks the depth technical teams need. This reality is how many organizations end up with multiple diagramming solutions to support different teams.
A next-gen diagramming solution, on the other hand, combines deep technical features with an intuitive, flexible interface in the same platform—no need to compromise. For example, with universal canvas, you can seamlessly switch between Lucidchart and Lucidspark (Lucid’s virtual whiteboarding application) as you move through the workflow and collaborate with different teams.
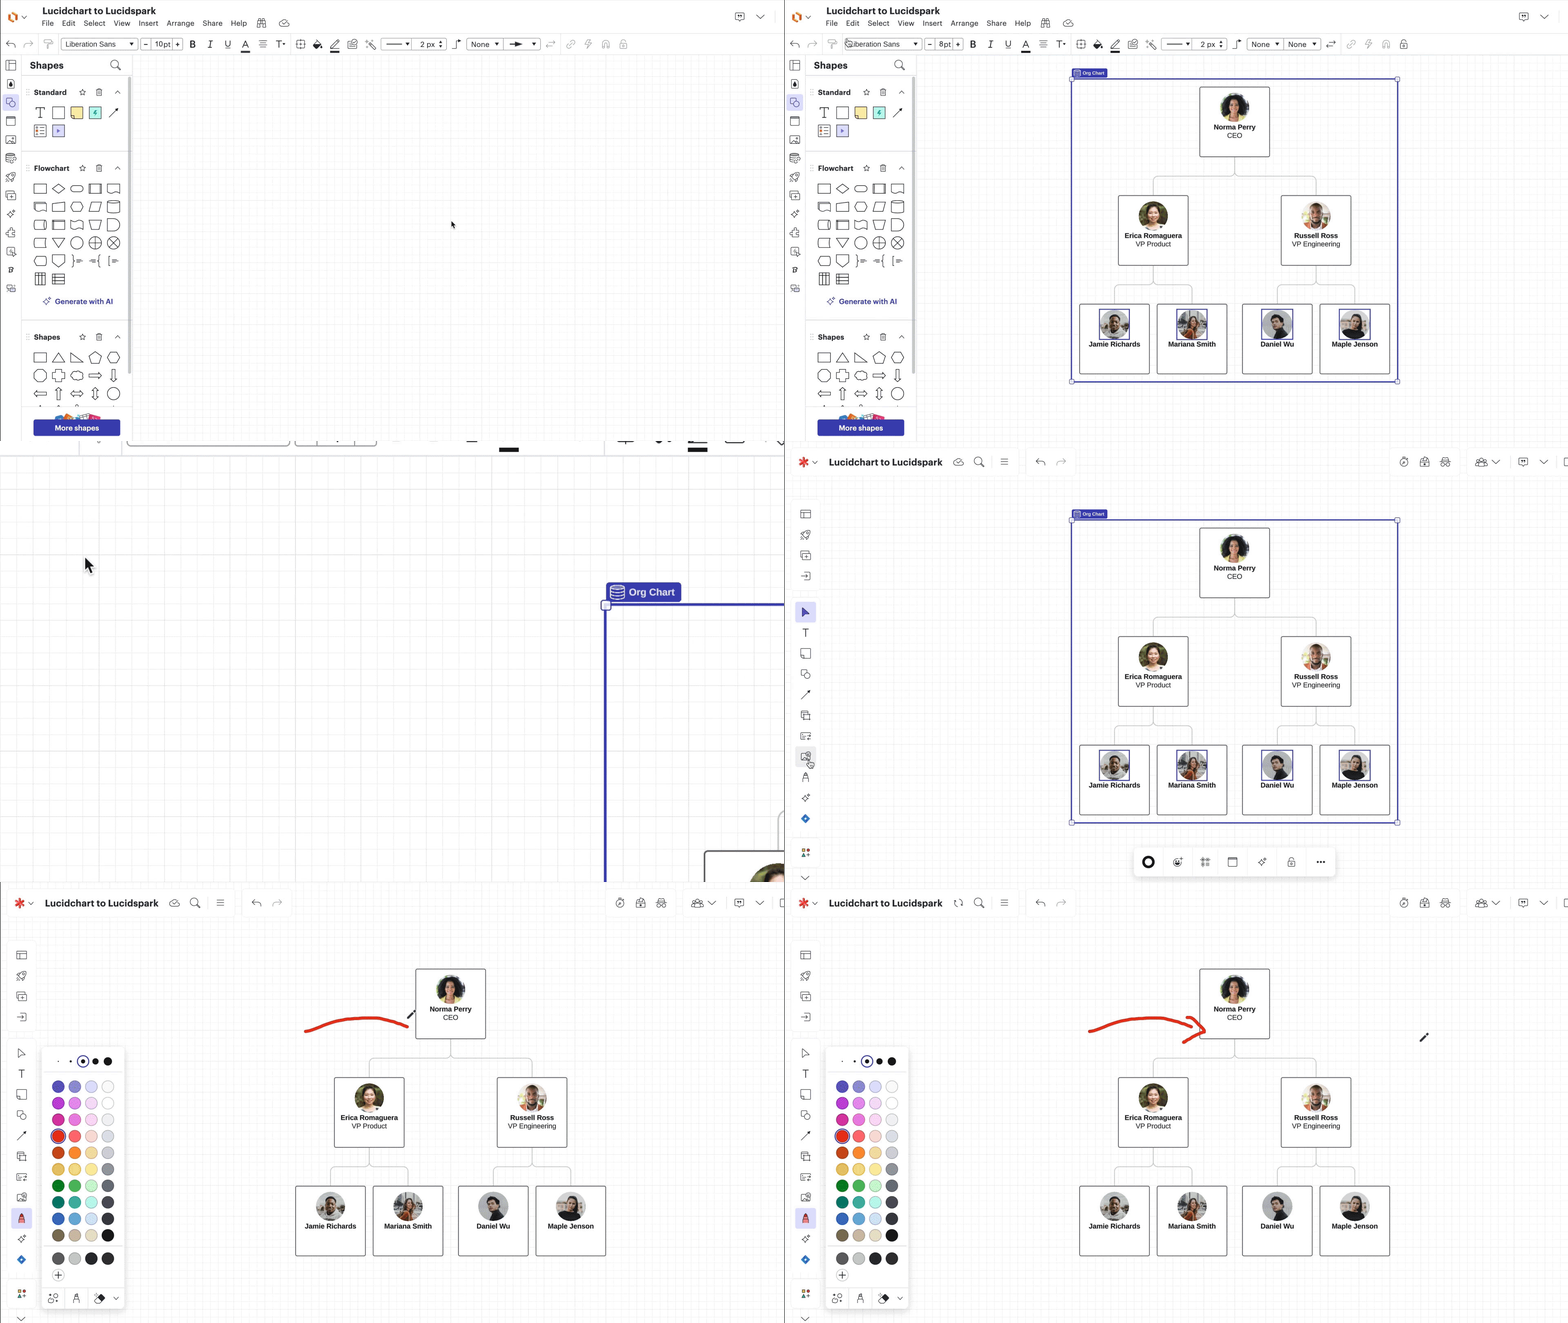
Whereas jumping into a different application to do one task can take teams out of their workflow or lead to lost context, Lucidchart puts those niche features at users' fingertips without compromising their experience for the rest of their tasks that don't require as much control or precision.

The hidden costs of Miro
Uncover the hidden costs of a platform that doesn’t cover the entire project workflow.
Go nowIt connects to live data
For anyone who thinks diagrams are always static, we’d like to be the first to bring you the good news that they don’t have to be! In fact, next-gen diagramming solutions are intelligent—meaning your diagrams are linked to your data, creating dynamic visuals that update in real time.
Unlike static diagramming solutions that must be manually updated, intelligent diagrams can simply be refreshed to show the most updated information, making them impactful and long-lasting artifacts.
What other data features separate a next-gen diagramming solution from a basic one? A few to look out for include:
-
Conditional formatting: The ability to create custom rules to easily spot important information in your diagram
-
Dynamic shapes: The ability to visualize data, such as progress, percentages, or ratings, by connecting to data or formulas
-
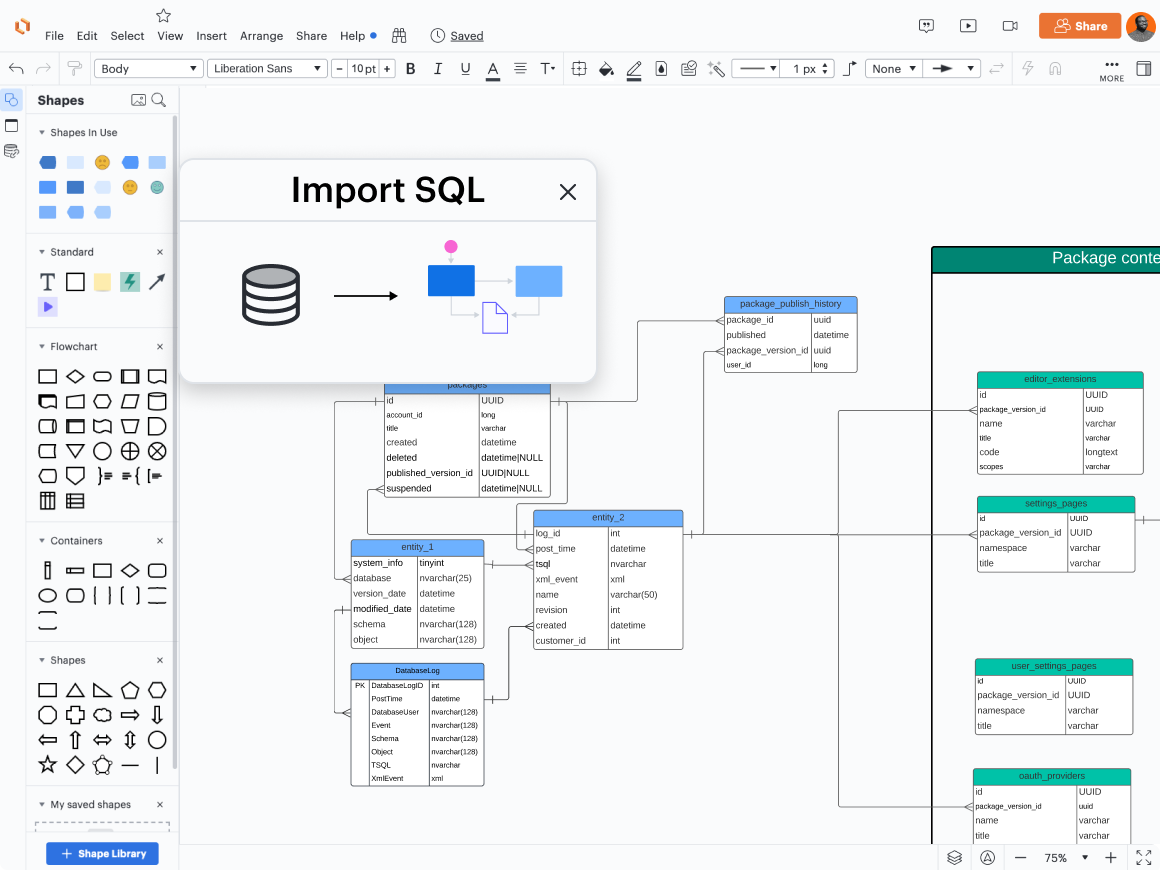
ERD functionality: The ability to automatically generate entity relationship diagrams (ERDs) by importing from SQL
In Lucid, you can even link your diagrams to live data from other apps, like Google Sheets and Microsoft Excel.

The most intelligent visual collaboration platform
Dive deeper into all the features that make Lucid the most intelligent visual collaboration platform available today.
Learn moreIt integrates with other apps in your workflow
One of the biggest red flags of a diagramming solution? A lack of integrations. If your diagramming solution is siloed off from the rest of your tech stack, you’ll have a difficult time moving projects forward efficiently (and you’ll end up with information scattered across tools).
The best diagramming solutions connect with other apps and continually add to their list of integrations to reduce redundant work and app switching. Additionally, because connected platforms reduce the number of handoffs and document sharing, they naturally enhance security and privacy.
A next-gen diagramming solution should integrate with your task management software, corporate wikis, meeting and communication software, and other systems of record. Lucidchart, for example, has taken a broad approach, offering over 100 integrations to leading providers. A few more of the most powerful integrations include:
-
Lucid Custom GPT: Turn text in ChatGPT to a diagram in Lucidchart.
-
Microsoft 365 Graph Connector: Find any Lucid document in Microsoft 365.
-
Confluence: Embed diagrams into Confluence pages for additional context.
-
Google Workspace: Add Google Docs, Sheets, or Slides to your Lucidchart document.
-
Salesforce: Create dynamic account maps and visualize your CRM architecture.
-
Microsoft 365: Enhance collaboration by adding diagrams to any Microsoft 365 apps.
Plus, with Lucid’s developer platform, organizations can even build custom APIs to support their unique use cases.
Check all the next-gen diagramming boxes with Lucidchart
With Lucidchart, you don’t have to choose between flexible, intuitive interfaces or robust intelligence features. Access hundreds of templates and integrations, work faster with advanced AI and data visualization, and pair with Lucidspark to unlock the full power of visual collaboration.

See next-gen diagramming in action
View the on-demand webinar to see demos of Lucidchart’s next-gen diagramming features.
Watch nowAbout Lucidchart
Lucidchart, a cloud-based intelligent diagramming application, is a core component of Lucid Software's Visual Collaboration Suite. This intuitive, cloud-based solution empowers teams to collaborate in real-time to build flowcharts, mockups, UML diagrams, customer journey maps, and more. Lucidchart propels teams forward to build the future faster. Lucid is proud to serve top businesses around the world, including customers such as Google, GE, and NBC Universal, and 99% of the Fortune 500. Lucid partners with industry leaders, including Google, Atlassian, and Microsoft. Since its founding, Lucid has received numerous awards for its products, business, and workplace culture. For more information, visit lucidchart.com.
Related articles
What is intelligent diagramming?
Intelligent diagramming refers to both a more intelligent way to diagram, as well as to the diagrams themselves, which are more intelligent and interactive.
8 reasons why Lucidchart is the perfect Microsoft Visio® replacement
Considering Lucidchart as a Visio® replacement? Learn about the features that put Lucidchart out on top, including ease of use, easier collaboration, and integrations with leading apps. With our Visio® import, it's easy to make the switch.
6 reasons to use Lucidchart instead of draw.io
Lucidchart is the intelligent diagramming application that offers a variety of data capabilities, whereas draw.io is only for basic diagramming needs.
Level up your spreadsheets with Lucid
Spreadsheets can be complex, but Lucid enables you to use them in a better way with dynamic features and capabilities.
Bring your bright ideas to life.
By registering, you agree to our Terms of Service and you acknowledge that you have read and understand our Privacy Policy.