For every type of process, there is a flowchart. For business, there’s even an entire process flowchart language. It’s called Business Process Model and Notation, or simply, BPMN 2.0. But if you’re an overscheduled business professional, learning a new diagramming language is likely to be the least pressing item on your to do list. And that probably won’t change. So let us do you a favor and make BPMN a little easier.
If overwhelmed, frustrated, or procrastinating describes your attitude toward BPMN diagrams, this one is for you. This BPMN tutorial will break down the basics of BPMN so you can start optimizing your business processes faster.
The value of BPMN diagrams
The main benefit of using BPMN is that it is a standardized diagramming language. Much like UML has standardized diagrams for software modeling, the creators of BPMN hoped that it would do the same for business. Therefore, by learning BPMN, you will be able to create and share diagrams that business stakeholders will readily understand. Not to mention, you will be able to understand diagrams that your colleagues share with you.
Interest in BPMN has increased significantly in the past decade. One survey points out that the interest in BPM among executives has increased by 73% in the global market. And nearly 75% said BPM processes and technologies helped their organizations meet their goals. This trend shows no sign of slowing down. The global BPM market is expected to reach $14.4 billion in 2025. In other words, learning BPMN can increase your value in the business world, especially if you are interested in process management.
So let’s review some BPMN basics.
The basic shapes of BPMN diagrams
BPMN notation includes dozens of specific shapes that fall into a few main groups: events, activities, gateways, connectors, pools, and artifacts.
Events

Every BPMN diagram starts and ends with an event. Events can also occur in the middle of a process and may include an icon that indicates the type of event represented. For more detail on events, see our complete guide.
Activities

Activities are represented by rectangles. They should always be labeled using the format verb + noun to represent an action. Check out our guide for more information.
Gateways

Gateways split and rejoin process flows. They are represented by a diamond shape and may contain icons to indicate the conditions for splitting and rejoining process flows. Learn more about specific gateways.
Connectors

Connectors, a.k.a. lines, show the flow from one element of a BPMN diagram to the next. Various line textures indicate the distinction between a flow of activities and a flow of messages. Get more detail here.
Pools

Just like in the Olympics, BPMN pools can be divided into swim lanes. Pools and swimlanes are used to show groups and individuals that are responsible for certain parts of a process. Every BPMN diagram must contain at least one pool with one swim lane.
Artifacts

Artifacts add additional information to a BPMN diagram. They include annotations, groups, and data objects, which you can read more about in our comprehensive guide.
How to draw BPMN diagrams
Before you start your BPMN diagram, define the scope of the process you are diagramming. This important step will determine the level of detail you should include. High-level diagrams should be general and leverage subprocesses and additional documentation to go further into detail.
Once you have clearly articulated your scope, it’s time to open a Lucidchart document and start dragging and dropping shapes onto the canvas. If you don’t have a Lucidchart account, you can set one up for free right now.

Build your BPMN in Lucidchart.
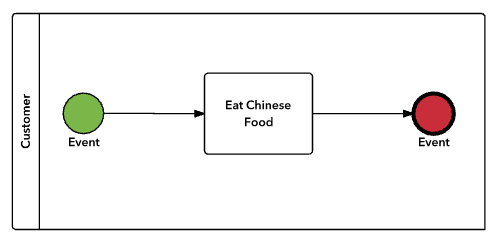
Start diagrammingYour first shape should be a start event. Because you know that your diagram will end with an end event, you can drag one of those onto the canvas as well. I’ve colored mine green and red. Even without the color coding, you can tell the difference between the start and end events because of the thickness of their borders. Standard notation for events requires a thin border for start events, a thick border for end events, and a double circle border for intermediate events.

Next, let’s add an activity and name it using the verb + noun format, like so:

Every BPMN diagram must have at least one pool with one swim lane, so let’s add one.

Voilá! You have a completed BPMN diagram. Of course, it’s very simplistic, so let’s add a bit more complexity.
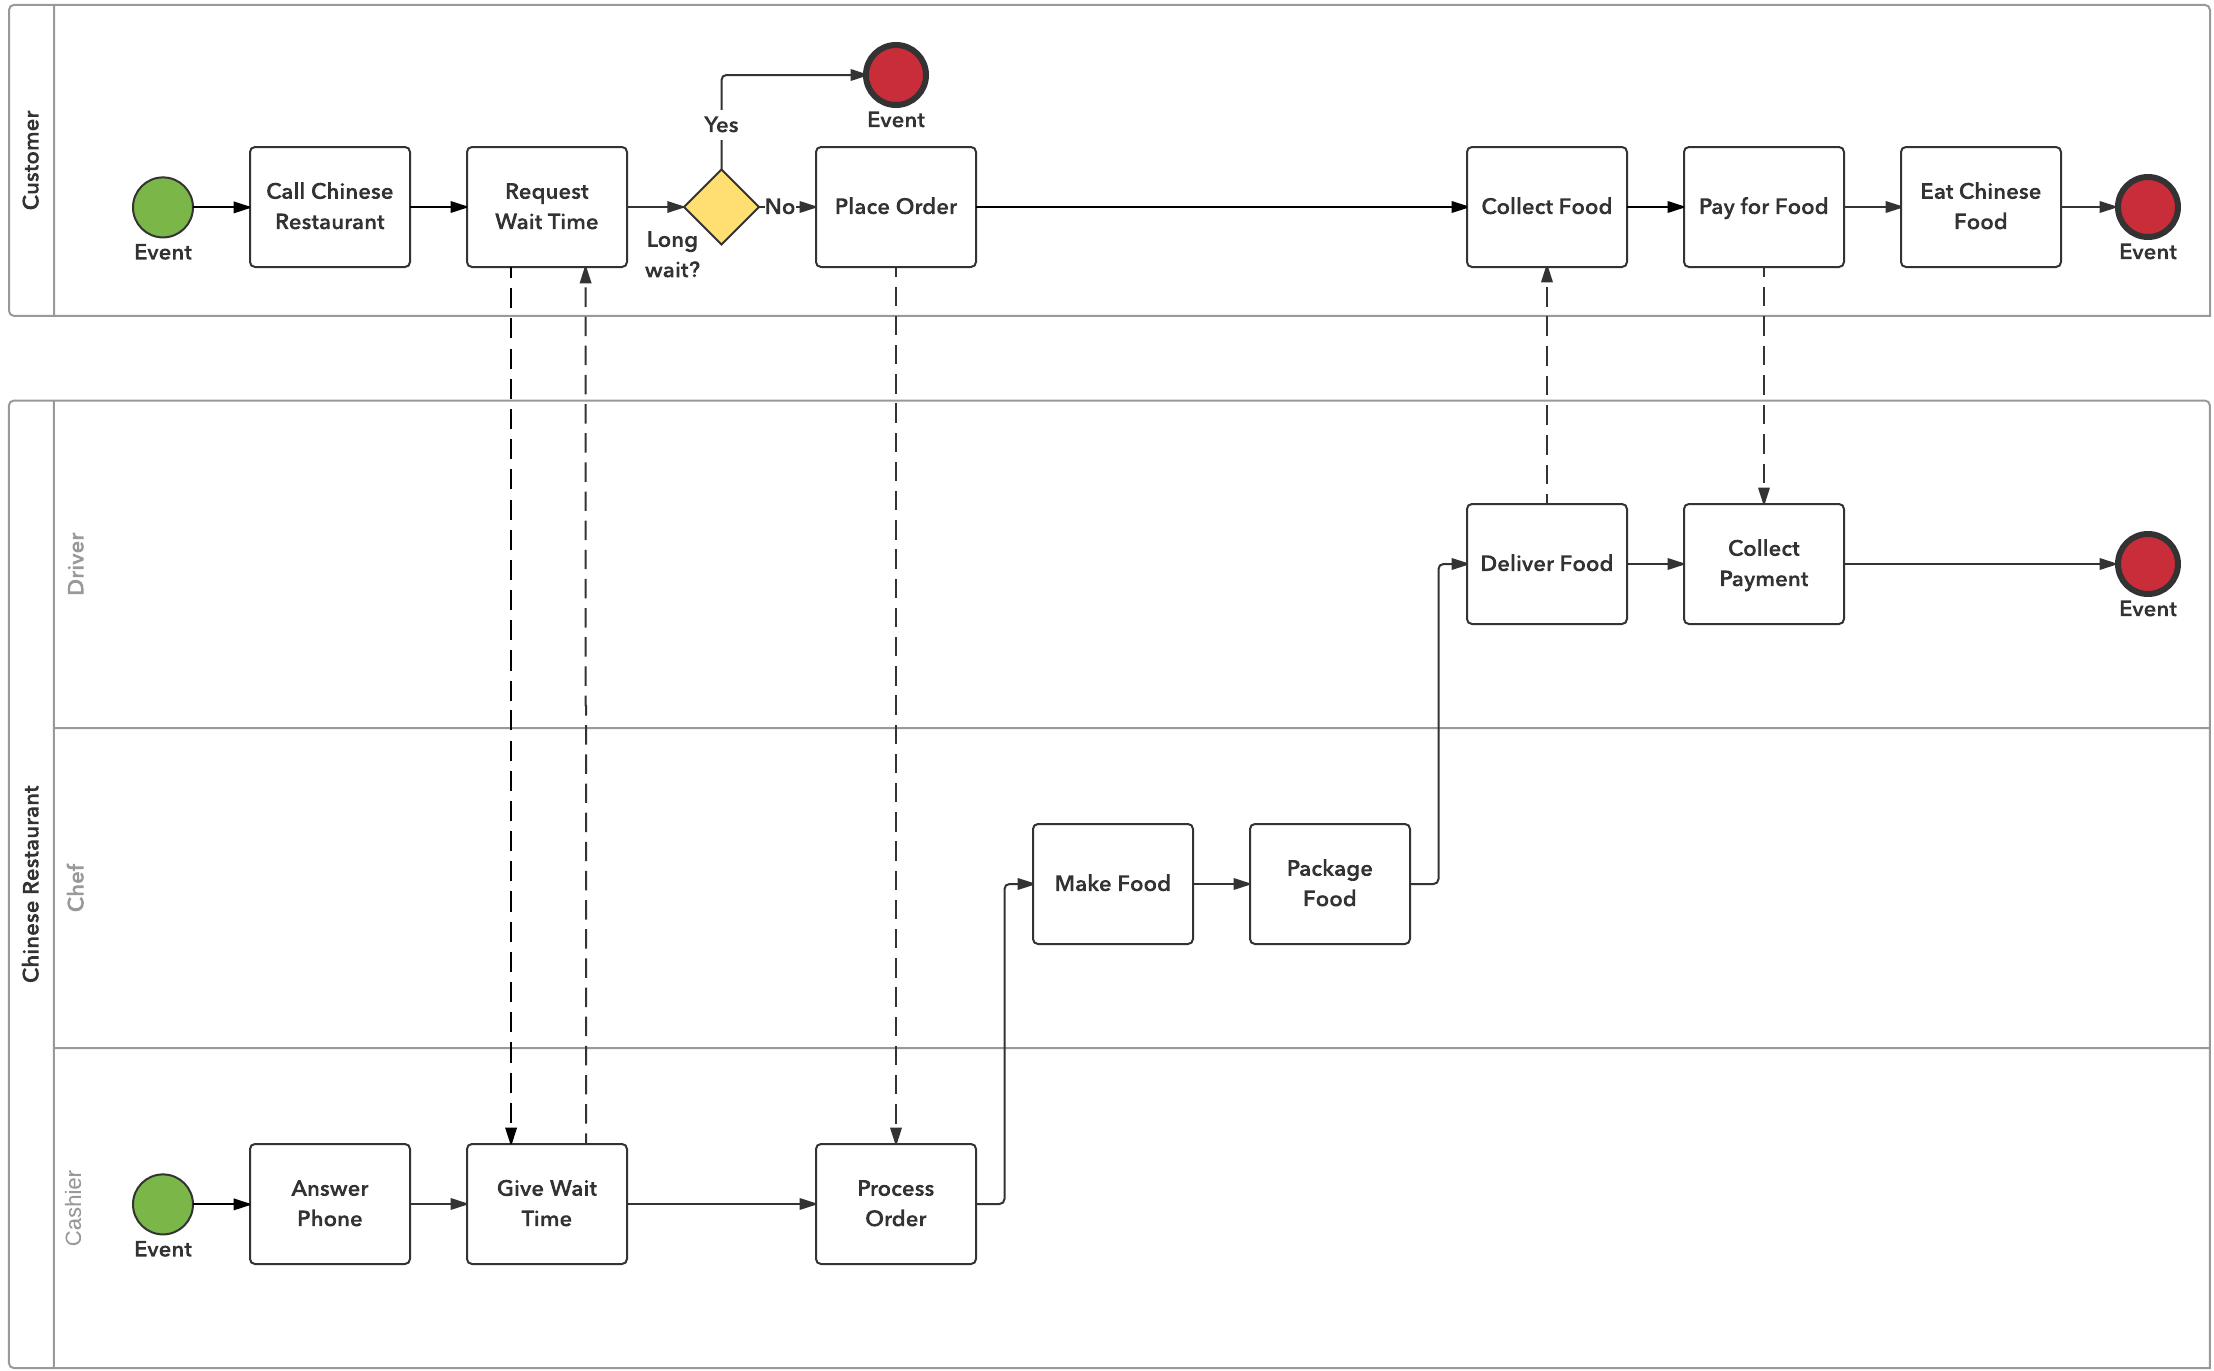
This BPMN example is still relatively simple, but it illustrates a number of key points and features you should keep in mind as you build your own BPMN diagram:
- Keep the direction of your flow consistent. Notice that even when moving between pools and swim lanes, the diagram always flows from left to right, never up and down.
- Make sure your connectors never cross over the top of each other. If the direction of your flow is consistent, this point should be relatively simple to follow.
- In the customer section, we used a gateway to show what happens during a long wait at the Chinese restaurant. Notice that the primary scenario is all level while the exception is tacked on above. Diagramming the primary scenario first helps to keep your BPMN diagram clean and easy to interpret.
- Include separate end events for distinct end states. For example, there are two end events in the customer pool: one represents a successful end state (eating Chinese food), while the other represents an unsuccessful end state (a long wait and no Chinese food).
- Only include one process in each pool. This BPMN diagram shows two processes that interact. One is the customer’s process, and the other is the restaurant’s process. They each have their own pool.
- When two pools interact, use dashed message connectors rather than solid sequence connectors.
Expert tips
BPMN experts give a number of tips for making professional diagrams.
First, keep your diagrams simple by clearly defining the scope of each BPMN. You can dig into details as needed by creating BPMN diagrams for subprocesses and sub-subprocesses. These sub-processes are especially easy to create in Lucidchart. Build a high level diagram, and then create additional tabs to build out separate, more detailed diagrams. You can link them all together using hotspots.
Keep your diagrams clean by adding details with separate documentation. For example, explain process requirements in a Google Doc, and then link to the Doc from your Lucidchart document. Links allow you to connect all of your information to one source without cluttering your diagram.
Next, when you print your BPMN diagram, make sure it fits on one page. Lucidchart makes this easy by including a “fit to print” feature. Simply highlight your diagram, navigate to the page settings, select your desired paper size, and then click on the icon that says “fit.” Lucidchart will automatically shrink or scale your diagram to fit the paper size you selected.
Finally, practice version control with your diagrams. Once you have finalized a process, make sure that it stays the way you left it. Lucidchart facilitates version control by letting you choose who can edit, comment on, and view your diagrams. And even if you experience unexpected changes, you can always return to a previous version with revision history.

Build your business process maps with our customizable Lucidchart template.
Try for freeAbout Lucidchart
Lucidchart, a cloud-based intelligent diagramming application, is a core component of Lucid Software's Visual Collaboration Suite. This intuitive, cloud-based solution empowers teams to collaborate in real-time to build flowcharts, mockups, UML diagrams, customer journey maps, and more. Lucidchart propels teams forward to build the future faster. Lucid is proud to serve top businesses around the world, including customers such as Google, GE, and NBC Universal, and 99% of the Fortune 500. Lucid partners with industry leaders, including Google, Atlassian, and Microsoft. Since its founding, Lucid has received numerous awards for its products, business, and workplace culture. For more information, visit lucidchart.com.
Related articles
7 tips for faster diagramming in Lucidchart
Whether you are a new diagrammer or a power user, check out these seven tips from Lucidchart product experts to learn how to diagram more efficiently.
Four project management best practices that'll keep your operations pipeline running smoothly
Project management best practices, frameworks, policies, and workflows can help organizations of all sizes operate more efficiently. By establishing ultra-responsive support and operations frameworks, these systems can also help minimize a number of common frustrations associated with professional relationships.
Effective Network Diagramming: Tips and Best Practices
If you have been tasked with creating network diagrams, especially for PCI compliance, Michael Maughan, a Security Analyst at SecurityMetrics, has delivered some tips to make sure you stay on track and use available resources to simplify the diagramming process.
How Lucidites Use Lucidchart: Diagrams for Engineering
Many software engineers use diagrams to architect new applications and systems and to prepare documentation for troubleshooting and training. Our engineers at Lucid Software are no different. They diagram as they work hard to make diagramming (and designing on Lucidpress) easier for you. Check out how our engineers have applied Lucidchart in various aspects of their jobs.


