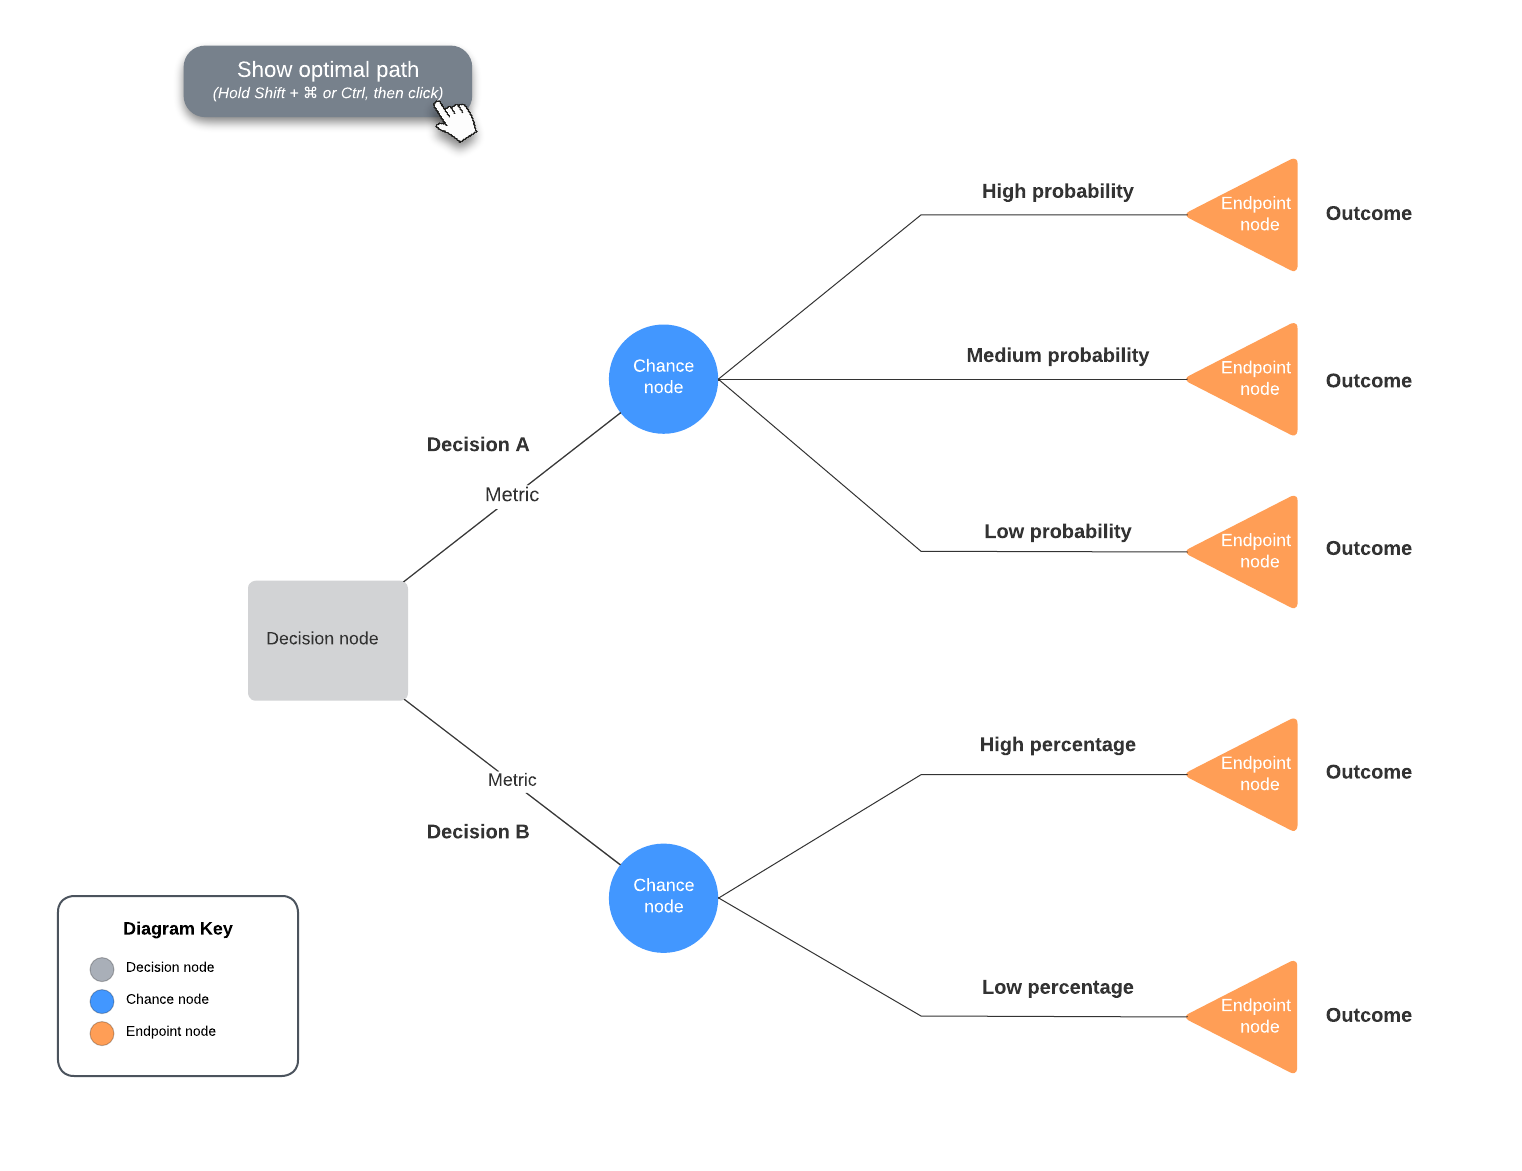
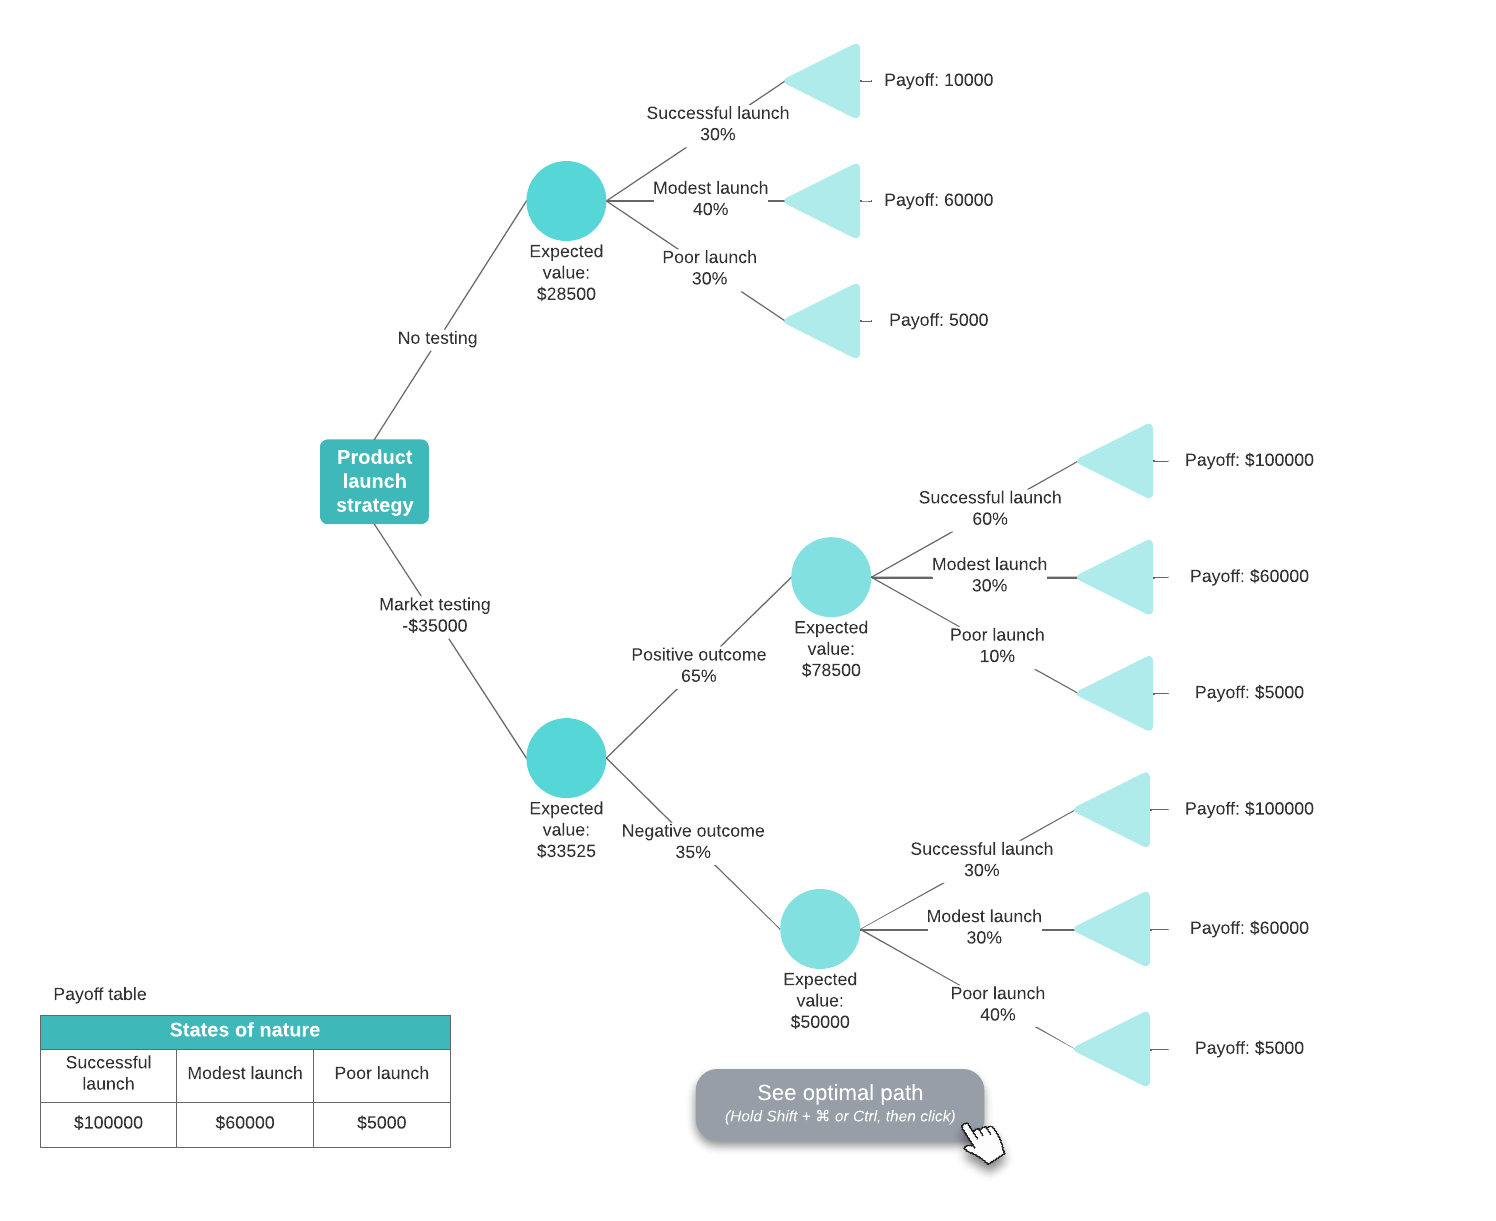
Decision tree analysis uses decision trees to assist with planning and making choices. Related choices are shown together in the decision tree and may include the probabilities of particular results along each branch. These frameworks are helpful for organizations because they allow teams to readily visualize decisions and relevant considerations. Using a decision tree, you can make the best choice among your various alternatives and reduce the potential for bias.
There are different types of decision trees, use cases for decision tree analysis, and core considerations to think about when you use decision trees in each context. Here’s how decision tree analysis works.
Types of decision tree diagrams
Generally speaking, there are two different types of decision trees: classification trees and regression trees. Both are valuable systems, but they work a bit differently and have their own distinct uses.
Classification trees
With classification trees, you can sort objects, units, outcomes, and groups into categories. You can set up different branches with characteristics that facilitate classification and have at-a-glance delineation among different categories.
For example, you can use a classification tree with data mining to help sort different types of outcomes into categories.
Regression trees
Regression trees, rather than helping with classification, help with prediction. A regression tree uses continuous variables—which are obtained through measurement—to select branches (or nodes). In other words, you might use a regression tree to sort outcomes based on their probability of happening.

When and why to use a decision tree
In business processes, development, and working with data, decision trees can be useful tools that clarify and streamline choices and outcomes. By bringing decisions into set formats with decision trees, you can make it easier to act quickly while following established processes. Knowing when to use decision trees makes it simpler to make decisions and can be valuable for writing algorithms as well.
Your organization, department, or team may have types of decisions that fit these use cases. Without a visual decision tree, your team may be thinking over each decision and storing information mentally, introducing the possibility for mistakes, slowed productivity, or bias in the decision-making process.
Here are a few different use cases for decision trees:
Repeated decisions
Repeated decisions that you’ll make multiple times are a great situation to use decision trees. You can refer back to the tree whenever you encounter a similar decision. This streamlines the process of making your choices and provides at-a-glance guidance so that you don’t have to reinvent your decision every time.
Minimize biases
With decision trees, you can establish criteria that determine decisions without bias or without introducing discrimination. Your decision tree is set to specific data, and every case or decision is then treated the same as others with the same variables. For instance, if one of the criteria states that all new customers receive a welcome promotion, then the promotion occurs without regard to other factors.
If the decision is made without a decision tree, eliminating bias may be difficult or impossible since there are no established rules, and the rules could be modified for each case.
Help users select a choice
Decision trees are also helpful in user-facing applications and cases. You can use a decision tree to provide a visual aid that represents many options alongside a justification for each. Using a decision tree as a model, you can build each option into a user-facing application. You could also use decision trees to visualize how a website works and how users will navigate through your site.
Internally, you could develop decision trees your organization can use. For instance, customer service or support agents can use decision trees to guide their interactions with clients.
How to make a decision tree in Lucidchart
Within Lucidchart, you can create your own decision trees using your labels and data. Lucidchart allows you to share and collaborate on decision tree diagrams in real time. You can also add comments and chat with collaborators, streamlining the process of developing your decision tree analysis with your team.

Before you create a decision tree chart, learn about the typical components and how to bring them together to illustrate your decisions.
Components of decision trees
Big decision
To start, your decision tree flows from one single node. This is your big decision that branches into other nodes. As the tree gets bigger, each node will branch into other nodes, some of which are other decisions and some are chance outcomes.
If you’re ready to create your tree, create your first node from the decision that begins your analysis.
Possible outcomes and final outcomes
After your decision node, branches lead to possible outcomes. Label each outcome or decision. These nodes lead to other nodes until your decision tree ends.
- Outcomes: Some branches are based on probability. For example, a decision to make a product may lead to these outcomes and probabilities: it sells (75%), it never ships (5%), or it doesn’t sell (20%). These three nodes are outcomes with percentages that clarify how likely they are to occur.
These branches continue to connect nodes until they reach the end of your decision analysis.
Branches or paths
Branches connect nodes in your decision tree. Often, these branches represent decisions made by whomever conducts the analysis.
- Decisions: Other branches are decisions that could be made. For instance, to make a product or buy the product from a vendor instead. A choice must be made and the team is free to make either choice—there isn’t necessarily a probability associated with the decision.
Decision tree analysis usage
The flexibility, simplicity, and utility of decision tree analysis makes it a popular tool for a wide range of business uses. They can become complicated, however, as the decision tree grows— potentially limiting their usefulness for some applications. Decision trees work best for use cases where you can visualize decisions without adding too much complexity for users. Even if the decision process itself is more complex, you may be able to simplify or truncate the chart you use to illustrate it.
Once you complete your tree, verify its values and underlying data before publishing and sharing an official version. Lucidchart’s collaboration features allow you to work on your tree with your team and share it with other departments or with your stakeholders. If you use Lucidchart to create your decision trees, you can publish them directly from the platform.

Want more details for making a decision tree?
Read moreAbout Lucidchart
Lucidchart, a cloud-based intelligent diagramming application, is a core component of Lucid Software's Visual Collaboration Suite. This intuitive, cloud-based solution empowers teams to collaborate in real-time to build flowcharts, mockups, UML diagrams, customer journey maps, and more. Lucidchart propels teams forward to build the future faster. Lucid is proud to serve top businesses around the world, including customers such as Google, GE, and NBC Universal, and 99% of the Fortune 500. Lucid partners with industry leaders, including Google, Atlassian, and Microsoft. Since its founding, Lucid has received numerous awards for its products, business, and workplace culture. For more information, visit lucidchart.com.
Related articles
How to make a decision tree in Word
With our diagramming software, it’s easy to learn how to make a tree diagram in Word. Drawings in Word can get messy, but our diagramming tool includes templates, intuitive features, and Microsoft integrations to help you easily build your diagram and insert it.
How to make a decision tree diagram in Google Docs
Learn how to make a tree diagram in Google Docs to enhance your reports and standardize best practices. The key is Lucidchart. Read more to see how!

