Preparing for a Lifetime of Learning: A Medical Student’s Lucidchart Story
Annika Wildenradt
Reading time: about 4 min
The rapid rate at which change is occurring in the 21st century means the skills one needs to succeed—professionally and personally—are in constant flux. To prepare students for 21st-century life, educators must help them become masters of learning, capable of initiating and adapting the learning process to meet the changing demands of their environments. By introducing them to Lucidchart’s adaptable features, educators can help students take ownership of their learning processes and set them up for a lifetime of success.
To better understand the power of Lucidchart as an educational tool, let's take a look at how April, a medical student at the University of Arizona, is using the platform.
Note: Click on any of the images in this article to take a closer look.
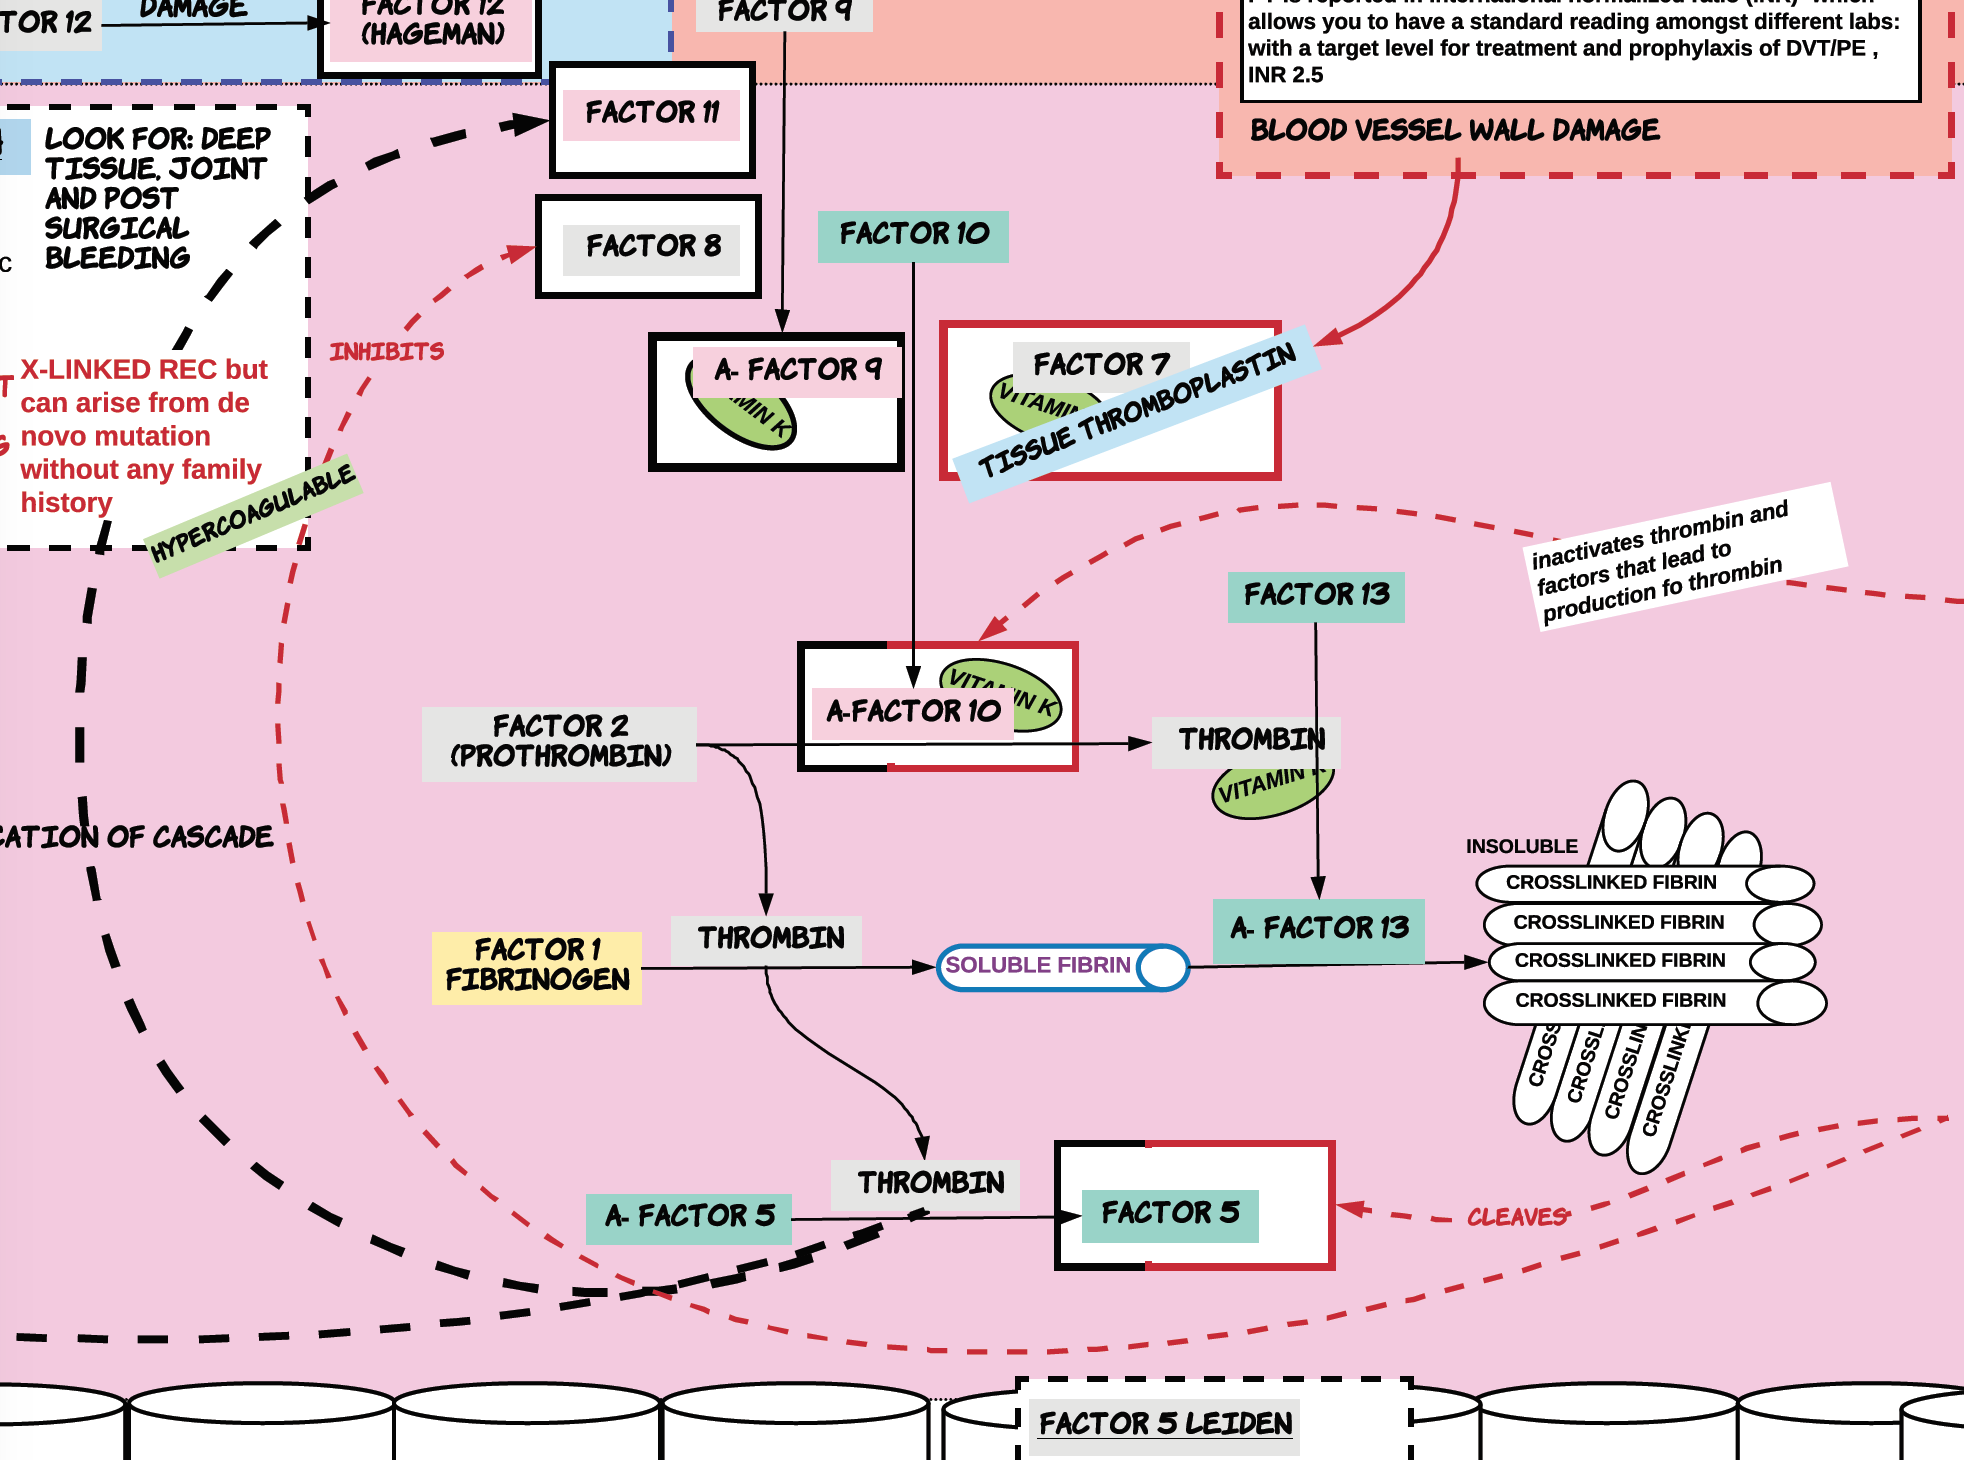
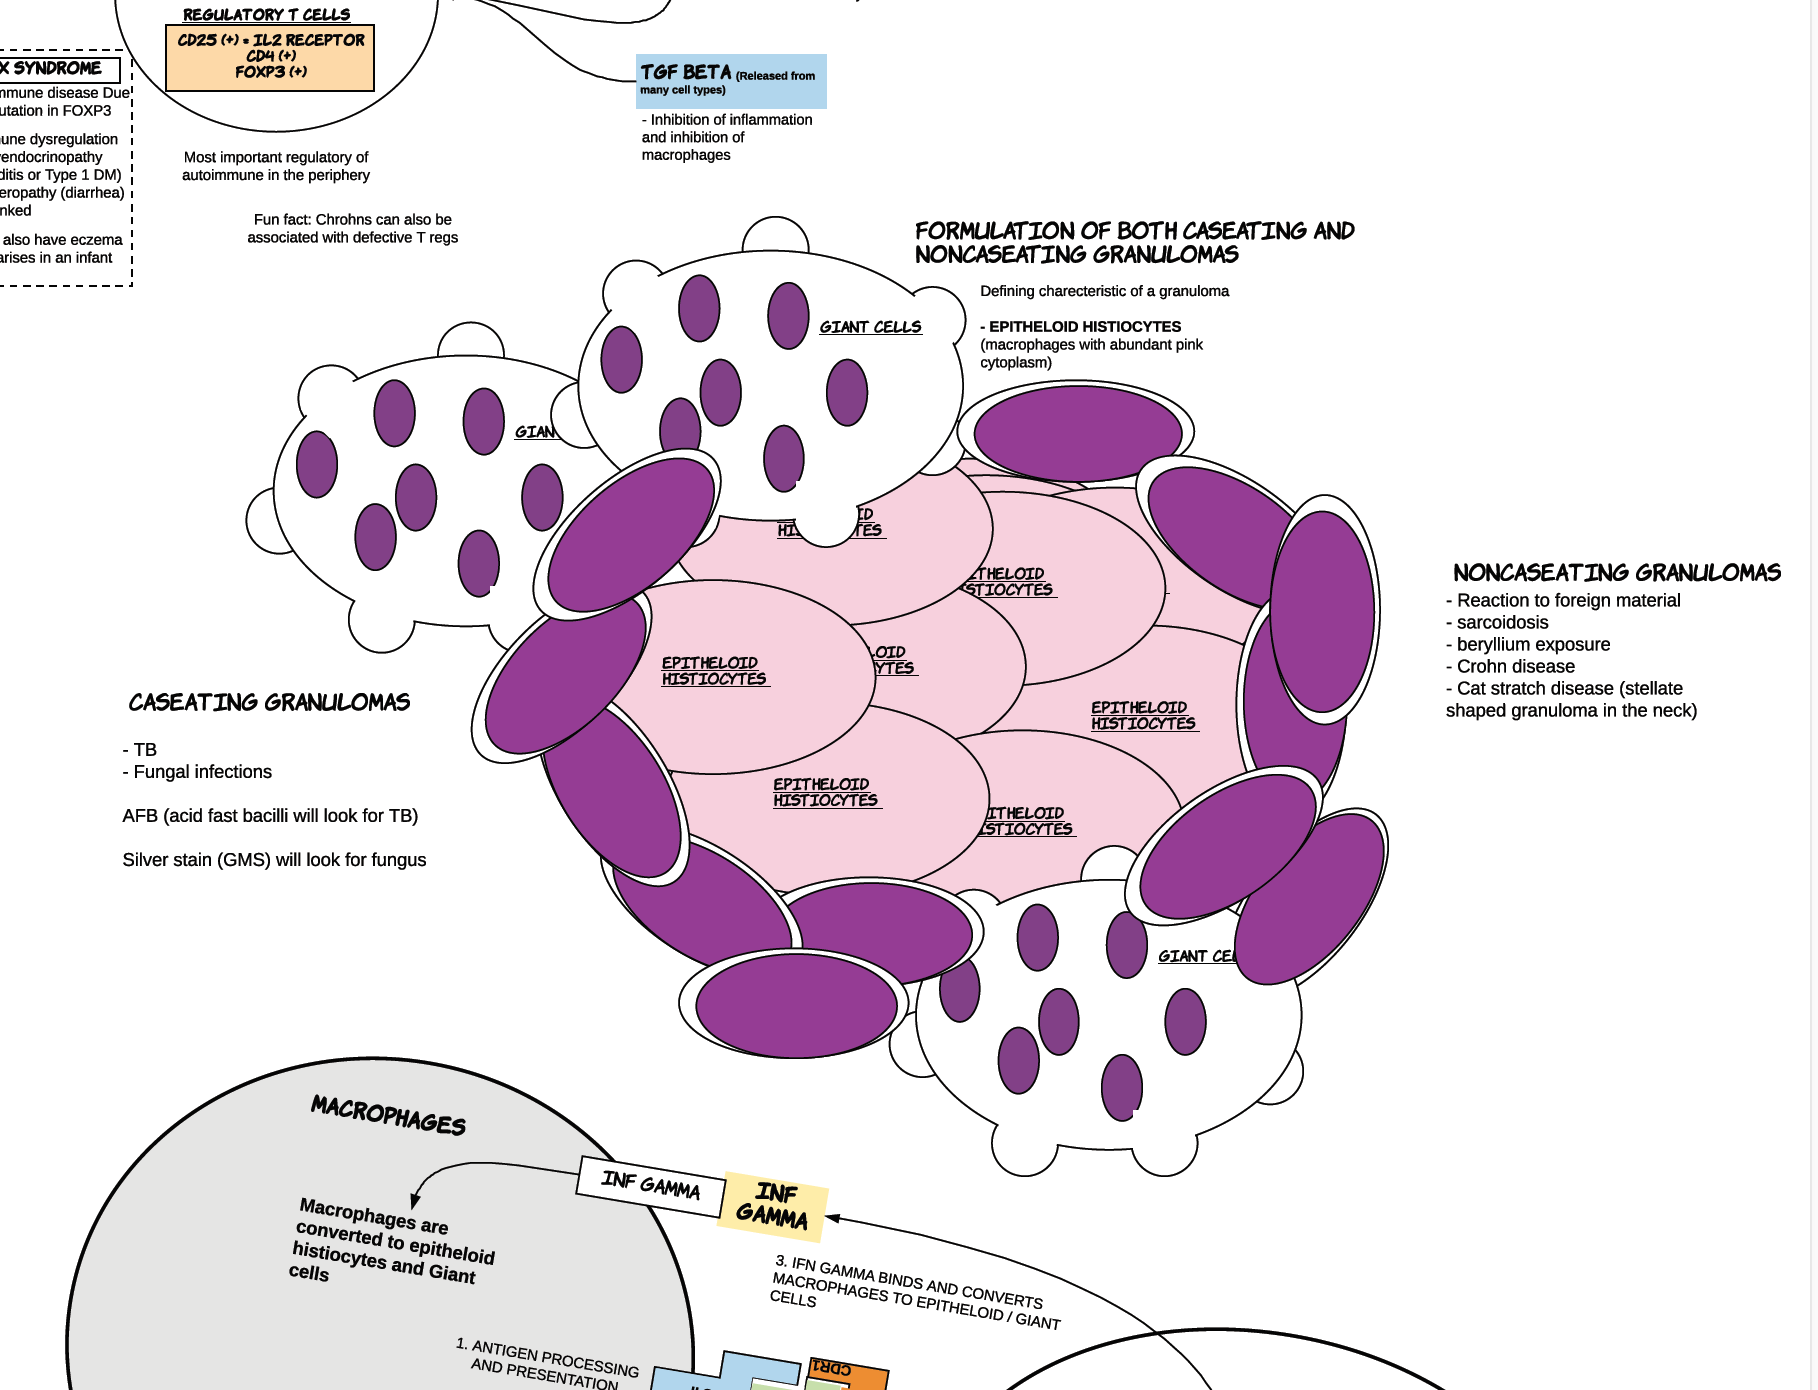
April creates concept maps such as this one to understand her course material. These maps consist of images that April imports into Lucidchart as well as objects that she designs from scratch. April adds colorful labels and lines to identify these objects and show how they are related.
Design, duplicate, group, repeat
April designs many of her maps’ components by modifying basic Lucidchart shapes such as circles and squares. By stretching, adding color to, and grouping these shapes, April transforms them into cells and other medical concepts.
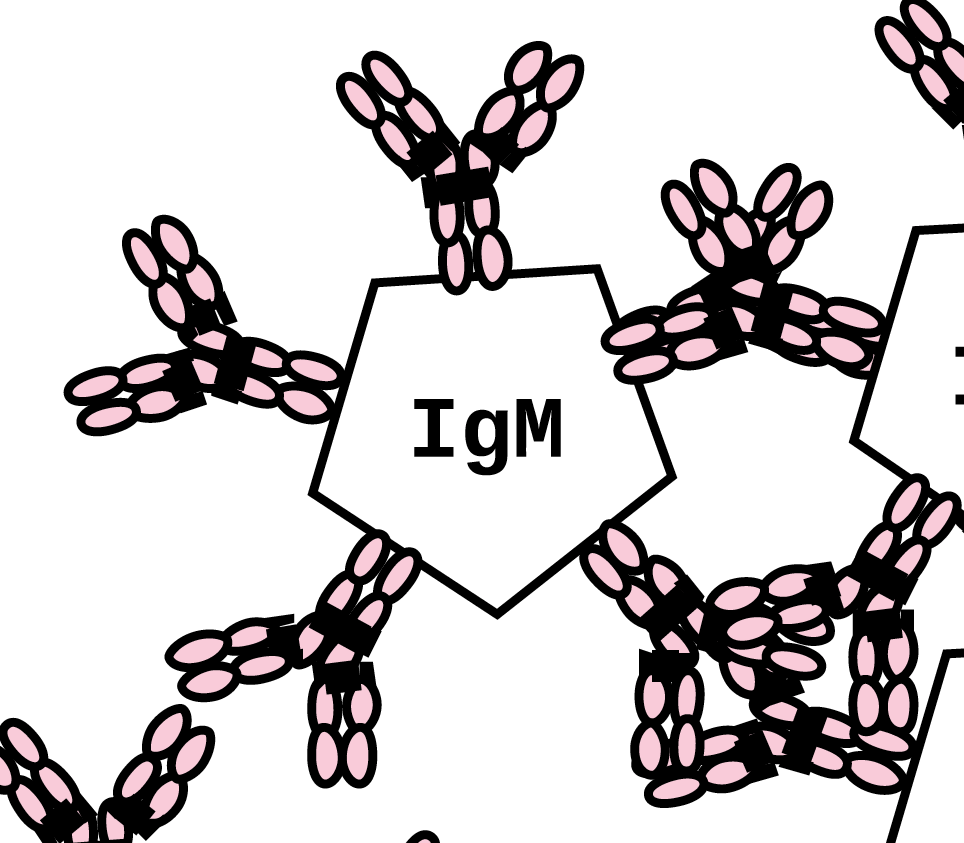
If we take a close look at this cluster of antibodies—one of the objects that April has designed—we can gain insight into how April uses Lucidchart’s capabilities to create these illustrations efficiently.
The most basic component of these antibodies is a basic circle—a shape native to Lucidchart—that April stretched into an oval and colored pink. April then duplicated this oval and arranged the duplicates to make a cluster of ovals that she grouped into a new shape. She followed this same process with the clusters to make the legs of the antibody, the Y shapes branching from the central pentagon.


By providing April with the ability to easily modify, duplicate, and group basic shapes to create new, more complex shapes, Lucidchart empowers her to become a designer.
An adaptive learning process
Beyond creating new shapes, April engages in the design process by integrating the individual components of her concept map into the greater structure around them. When she adds objects to the diagram by importing images or designing shapes, she engages with Lucidchart’s easy-to-use interface to move them into the diagram and adapts the diagram to accommodate them. With the platform’s change management features, April can easily undo her changes and look through past versions of her diagram.
By facilitating April’s design process, Lucidchart helps April learn. By incorporating a new object into her diagram, April is modifying her existing schema of knowledge to accommodate a new piece of information—the essence of learning. By making it easy for April to adapt her schema of knowledge when she encounters new material, Lucidchart makes it easy for April to engage in the learning process.
By understanding April’s work, we can see how Lucidchart can help students engage in the learning process.
A limitless workspace
April is even a designer of her own workspace! The content of April’s diagram is not completely unified: April is working with disconnected material that spans the Lucidchart canvas.
Lucidchart’s auto-tiling feature allows her to mold the canvas to the shape of her map. Just as she can change her diagram to accommodate new information, April can enable Lucidchart’s auto-tiling feature to expand or shrink her canvas based on the size or shape of her diagram. In Lucidchart, April is able to design a workspace that matches the current structure of her schema of knowledge.
By modifying shapes and incorporating them into her Lucidchart diagram, April is designing a learning process. By showing students that they, like April, can design their own learning process, we can help them become confident learners, eager to take on the challenge of change. Before long, these students will be the drivers of change and push the century into something new and better. For now, they can start with Lucidchart.
Join 2.5 million students and educators using Lucidchart.
About the author

San Francisco native and recent English graduate of the University of Michigan, Annika Wildenradt is now working as a content specialist on the customer ops team at Lucid. Outside of work Annika likes to travel, bake pies, write stories for kids, and paint pictures of make-believe creatures and worlds.
About Lucidchart
Lucidchart, a cloud-based intelligent diagramming application, is a core component of Lucid Software's Visual Collaboration Suite. This intuitive, cloud-based solution empowers teams to collaborate in real-time to build flowcharts, mockups, UML diagrams, customer journey maps, and more. Lucidchart propels teams forward to build the future faster. Lucid is proud to serve top businesses around the world, including customers such as Google, GE, and NBC Universal, and 99% of the Fortune 500. Lucid partners with industry leaders, including Google, Atlassian, and Microsoft. Since its founding, Lucid has received numerous awards for its products, business, and workplace culture. For more information, visit lucidchart.com.
Related articles
Concept map templates and examples
Need a concept map to make sense of complex ideas? Lucidchart can get you started—take a look at our customizable concept map templates.
How I Use Lucidchart to Diagnose Patients and Train New Doctors
Today’s blog post was written by Tom Fadial, MD. On Twitter, Tom mentioned that he used Lucidchart in a unique way: to create nearly 100 emergency algorithms that create a systematic approach for evaluating and managing a patient’s diagnosis. We were excited that Lucidchart could play a part in administering care and training medical students, and we asked him to tell us and our readers more about this project.


