Problem-solving flowchart: A visual method to find perfect solutions
Reading time: about 7 min
Topics:
“People ask me questions
Lost in confusion
Well, I tell them there's no problem
Only solutions”—John Lennon, “Watching the Wheels”
Despite John Lennon’s lyrics, nobody is free from problems, and that’s especially true in business. Chances are that you encounter some kind of problem at work nearly every day, and maybe you’ve had to “put out a fire” before lunchtime once or twice in your career.
But perhaps what Lennon’s saying is that, no matter what comes our way, we can find solutions. How do you approach problems? Do you have a process in place to ensure that you and your co-workers come to the right solution?
In this article, we will give you some tips on how to find solutions visually through a problem-solving flowchart and other methods.
What is visual problem-solving?
If you are a literal thinker, you may think that visual problem-solving is something that your ophthalmologist does when your vision is blurry. For the rest of us, visual problem-solving involves executing the following steps in a visual way:
- Define the problem.
- Brainstorm solutions.
- Pick a solution.
- Implement solutions.
- Review the results.
Learn more about the steps involved in the problem-solving process.
How to make your problem-solving process more visual
Words pack a lot of power and are very important to how we communicate on a daily basis. Using words alone, you can brainstorm, organize data, identify problems, and come up with possible solutions. The way you write your ideas may make sense to you, but it may not be as easy for other team members to follow.
When you use flowcharts, diagrams, mind maps, and other visuals, the information is easier to digest. Your eyes dart around the page quickly gathering information, more fully engaging your brain to find patterns and make sense of the data.
Identify the problem with mind maps
So you know there is a problem that needs to be solved. Do you know what that problem is? Is there only one problem? Is the problem sum total of a bunch of smaller problems?
You need to ask these kinds of questions to be sure that you are working on the root of the issue. You don’t want to spend too much time and energy solving the wrong problem.
To help you identify the problem, use a mind map. Mind maps can help you visually brainstorm and collect ideas without a strict organization or structure. A mind map more closely aligns with the way a lot of our brains work—participants can bounce from one thought to the next defining the relationships as they go.

Mind mapping to solve a problem includes, but is not limited to, these relatively easy steps:
- In the center of the page, add your main idea or concept (in this case, the problem).
- Branch out from the center with possible root causes of the issue. Connect each cause to the central idea.
- Branch out from each of the subtopics with examples or additional details about the possible cause. As you add more information, make sure you are keeping the most important ideas closer to the main idea in the center.
- Use Collaborative AI to generate or expand on your ideas, so your mind map is as complete as possible.
Alternatively, you could use mind maps to brainstorm solutions once you discover the root cause. Try our free mind map template or add the mind map shape library to quickly start your own mind map.
Create a problem-solving flowchart
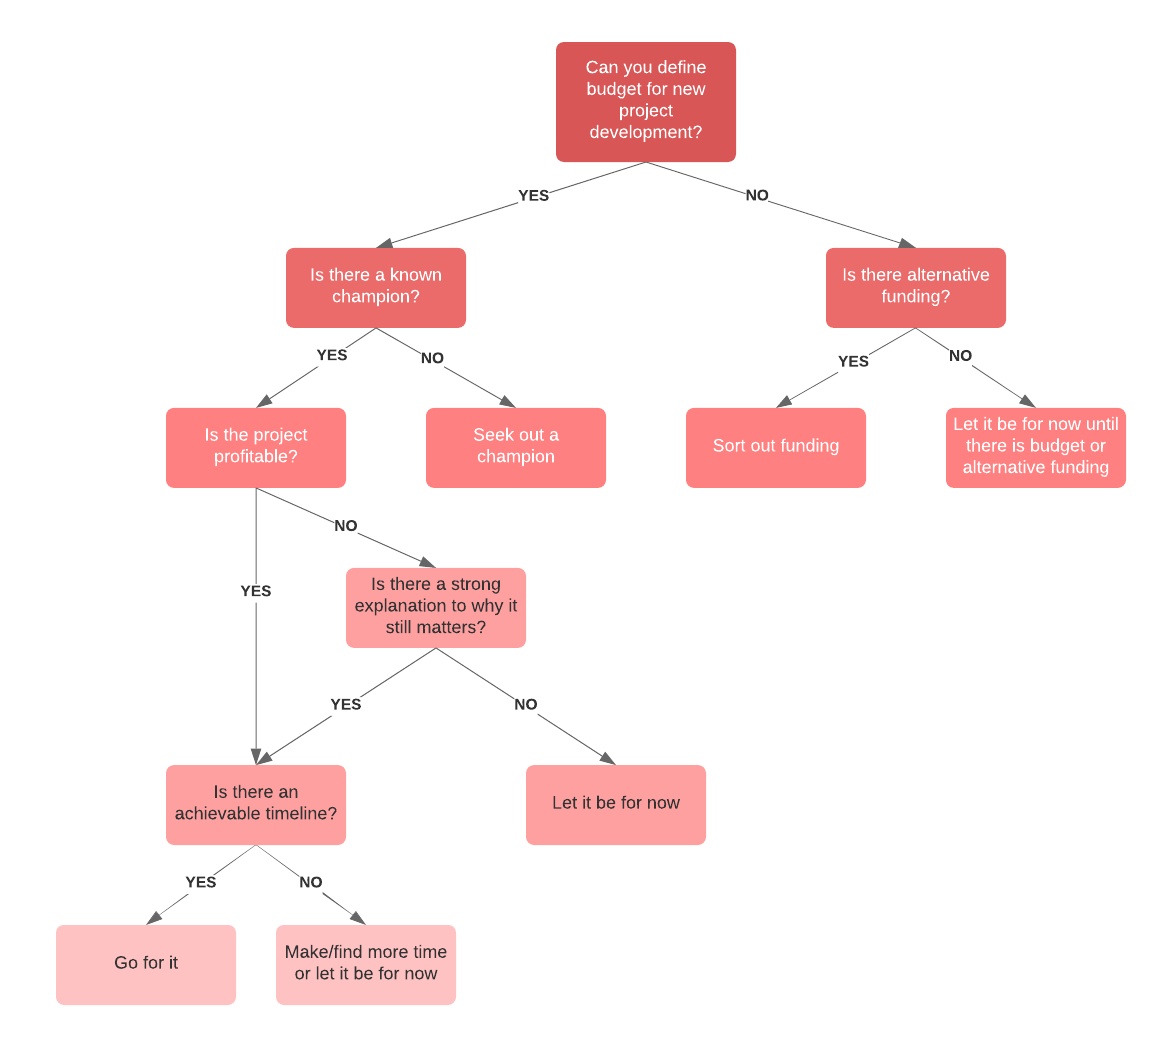
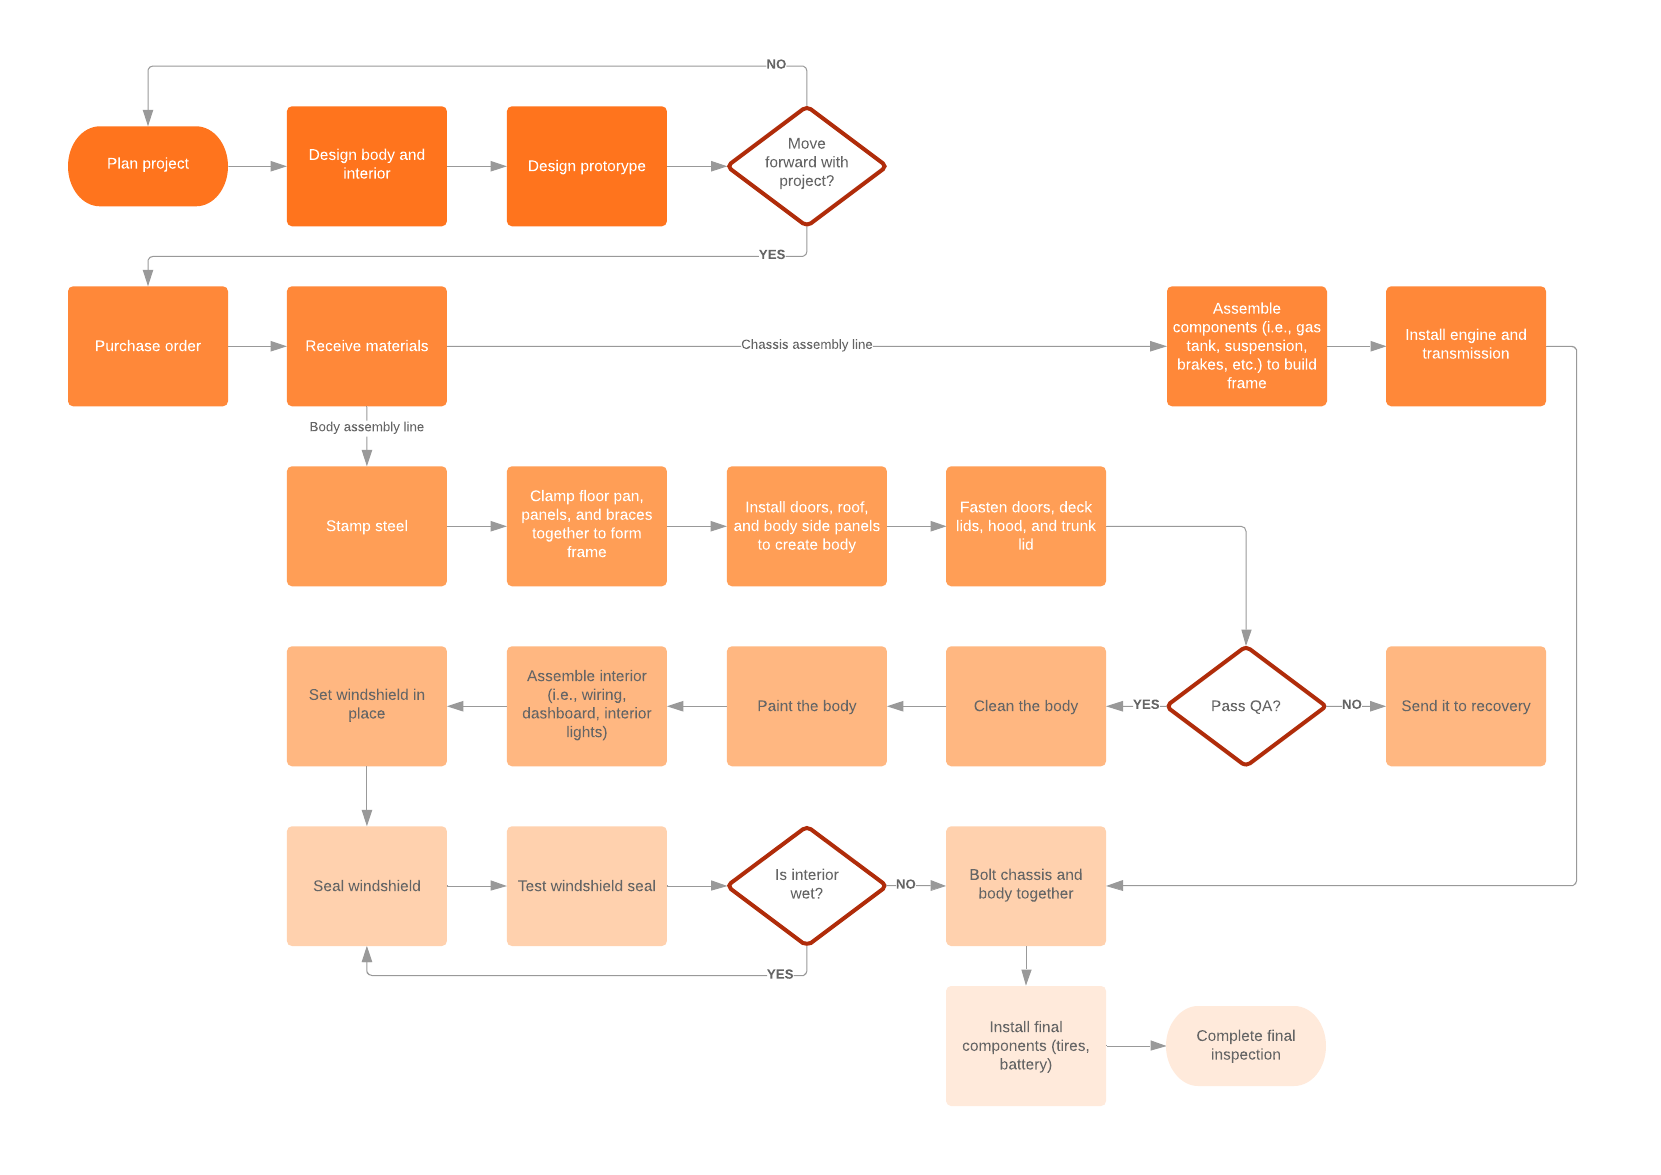
A mind map is generally a good tool for non-linear thinkers. However, if you are a linear thinker—a person who thinks in terms of step-by-step progression making a flowchart may work better for your problem-solving strategy. A flowchart is a graphical representation of a workflow or process with various shapes connected by arrows representing each step.
Whether you are trying to solve a simple or complex problem, the steps you take to solve that problem with a flowchart are easy and straightforward. Using boxes and other shapes to represent steps, you connect the shapes with arrows that will take you down different paths until you find the logical solution at the end.

Flowcharts or decision trees are best used to solve problems or answer questions that are likely to come up multiple times. For example, Yoder Lumber, a family-owned hardwood manufacturer, built decision trees in Lucidchart to demonstrate what employees should do in the case of an injury.
To start your problem-solving flowchart, follow these steps:
- Draw a starting shape to state your problem.
- Draw a decision shape where you can ask questions that will give you yes-or-no answers.
- Based on the yes-or-no answers, draw arrows connecting the possible paths you can take to work through the steps and individual processes.
- Continue following paths and asking questions until you reach a logical solution to the stated problem.
- Try the solution. If it works, you’re done. If it doesn’t work, review the flowchart to analyze what may have gone wrong and rework the flowchart until you find the solution that works.
If your problem involves a process or workflow, you can also use flowcharts to visualize the current state of your process to find the bottleneck or problem that’s costing your company time and money.

Lucidchart has a large library of flowchart templates to help you analyze, design, and document problem-solving processes or any other type of procedure you can think of.
Draw a cause-and-effect diagram
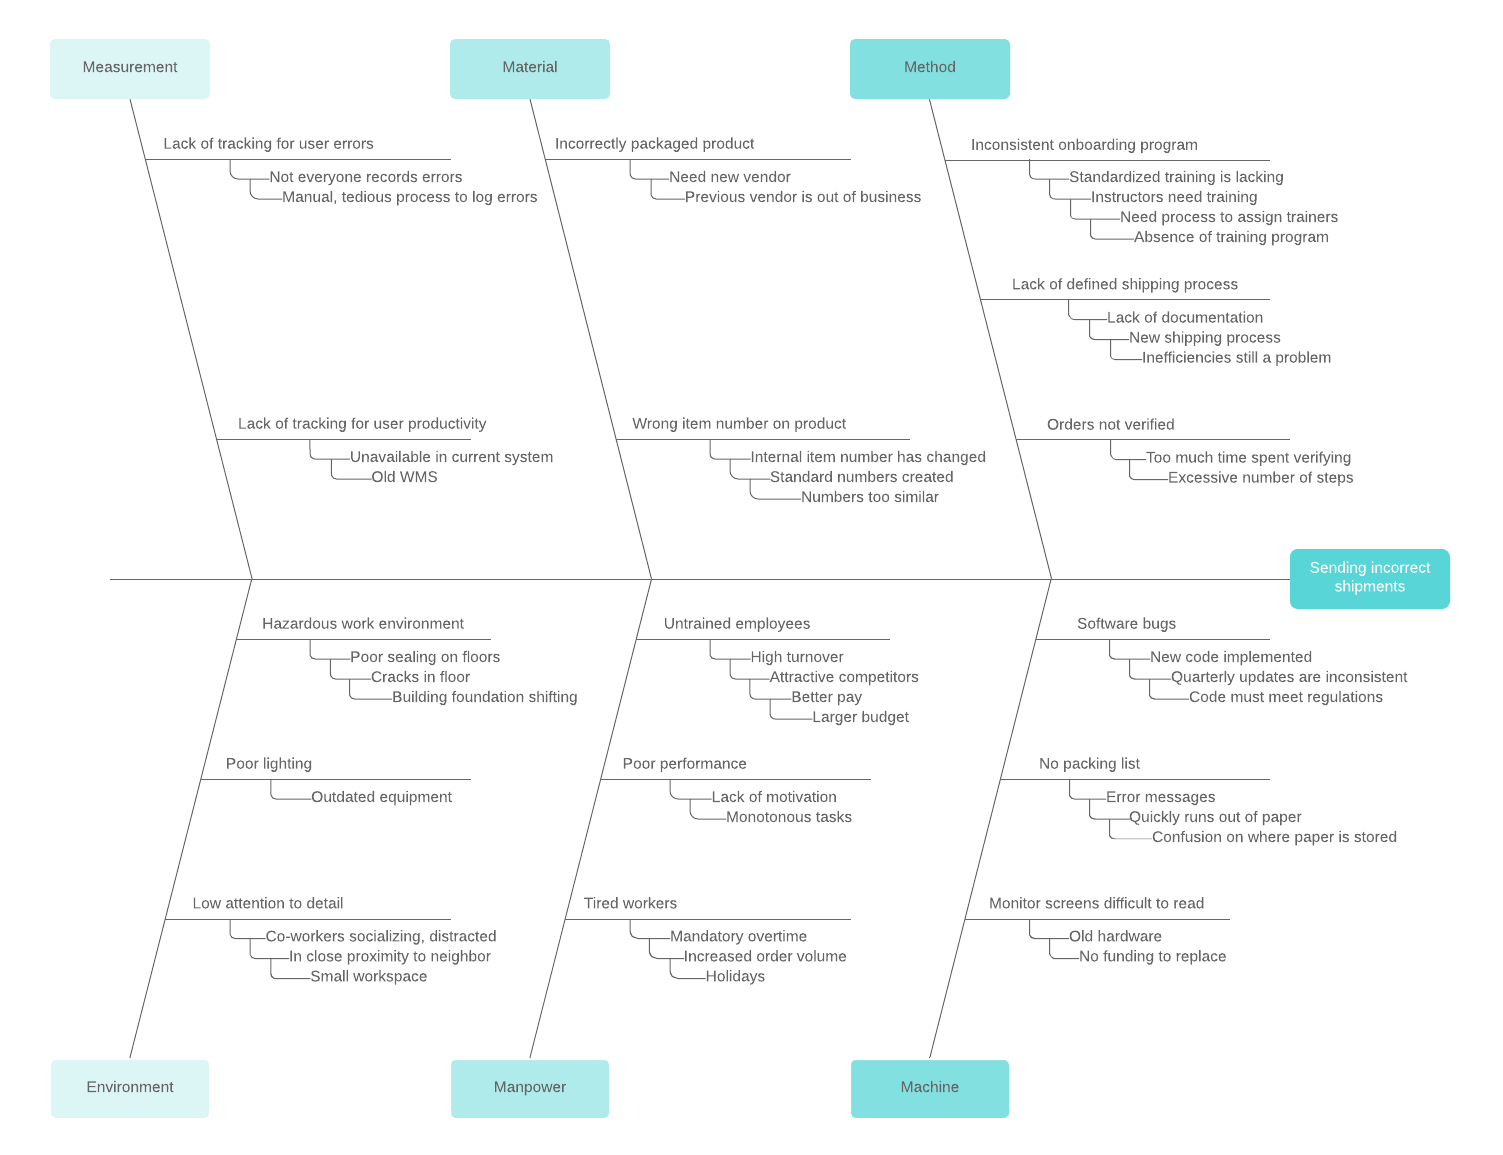
A cause-and-effect diagram is used to analyze the relationship between an event or problem and the reason it happened. There is not always just one underlying cause of a problem, so this visual method can help you think through different potential causes and pinpoint the actual cause of a stated problem.
Cause-and-effect diagrams, created by Kaoru Ishikawa, are also known as Ishikawa diagrams, fishbone diagrams, or herringbone diagrams (because they resemble a fishbone when completed). By organizing causes and effects into smaller categories, these diagrams can be used to examine why things went wrong or might go wrong.

To perform a cause-and-effect analysis, follow these steps.
1. Start with a problem statement.
The problem statement is usually placed in a box or another shape at the far right of your page. Draw a horizontal line, called a “spine” or “backbone,” along the center of the page pointing to your problem statement.
2. Add the categories that represent possible causes.
For example, the category “Materials” may contain causes such as “poor quality,” “too expensive,” and “low inventory.” Draw angled lines (or “bones”) that branch out from the spine to these categories.
3. Add causes to each category.
Draw as many branches as you need to brainstorm the causes that belong in each category.
Like all visuals and diagrams, a cause-and-effect diagram can be as simple or as complex as you need it to be to help you analyze operations and other factors to identify causes related to undesired effects.
Collaborate with Lucidchart
You may have superior problem-solving skills, but that does not mean that you have to solve problems alone. The visual strategies above can help you engage the rest of your team. The more involved the team is in the creation of your visual problem-solving narrative, the more willing they will be to take ownership of the process and the more invested they will be in its outcome.
In Lucidchart, you can simply share the documents with the team members you want to be involved in the problem-solving process. It doesn’t matter where these people are located because Lucidchart documents can be accessed at any time from anywhere in the world.
Whatever method you decide to use to solve problems, work with Lucidchart to create the documents you need. Sign up for a free account today and start diagramming in minutes.
About Lucidchart
Lucidchart, a cloud-based intelligent diagramming application, is a core component of Lucid Software's Visual Collaboration Suite. This intuitive, cloud-based solution empowers teams to collaborate in real-time to build flowcharts, mockups, UML diagrams, customer journey maps, and more. Lucidchart propels teams forward to build the future faster. Lucid is proud to serve top businesses around the world, including customers such as Google, GE, and NBC Universal, and 99% of the Fortune 500. Lucid partners with industry leaders, including Google, Atlassian, and Microsoft. Since its founding, Lucid has received numerous awards for its products, business, and workplace culture. For more information, visit lucidchart.com.
Related articles
How you can use creative problem solving at work
Sometimes you're faced with challenges that traditional problem solving can't fix. Creative problem solving encourages you to find new, creative ways of thinking that can help you overcome the issue at hand more quickly.
Dialogue mapping 101: How to solve problems through visuals
Dialogue mapping is a facilitation technique used to visualize critical thinking as a group. Learn how you and your team can start dialogue mapping today to solve problems and bridge gaps in knowledge and understanding (plus get a free template!).
