How Dan Leads Prospects to Closed-Won in Lucidchart
Lucid Content
Reading time: about 6 min
Topics:

After 15 years working in sales engineering and architecture, Dan Marma is well versed in the sales process. He even has a nickname for it: “dating.” And when you refer to sales as dating, you might as well refer to Dan as Okta’s main wingman.
Dan is confident Okta can seamlessly and securely connect any person with any application on any device. As a sales architect, Dan is in charge of instilling that same trust in potential customers. He strives to prove to customers in the pre-sale process that what Okta brings to the table is exactly the solution they need. In other words, Dan is that faithful buddy you had in college who talked you up to the girl you were crushing on—and ultimately landed you a date with her for Friday.
But in this “dating phase,” it’s not enough to just talk about what Okta can provide a company. What sets Dan apart as wingman is his ability to show what Okta will do. And in order to do that, all Dan has to do is open Lucidchart.
Bridging the gap from pre-sale to sale
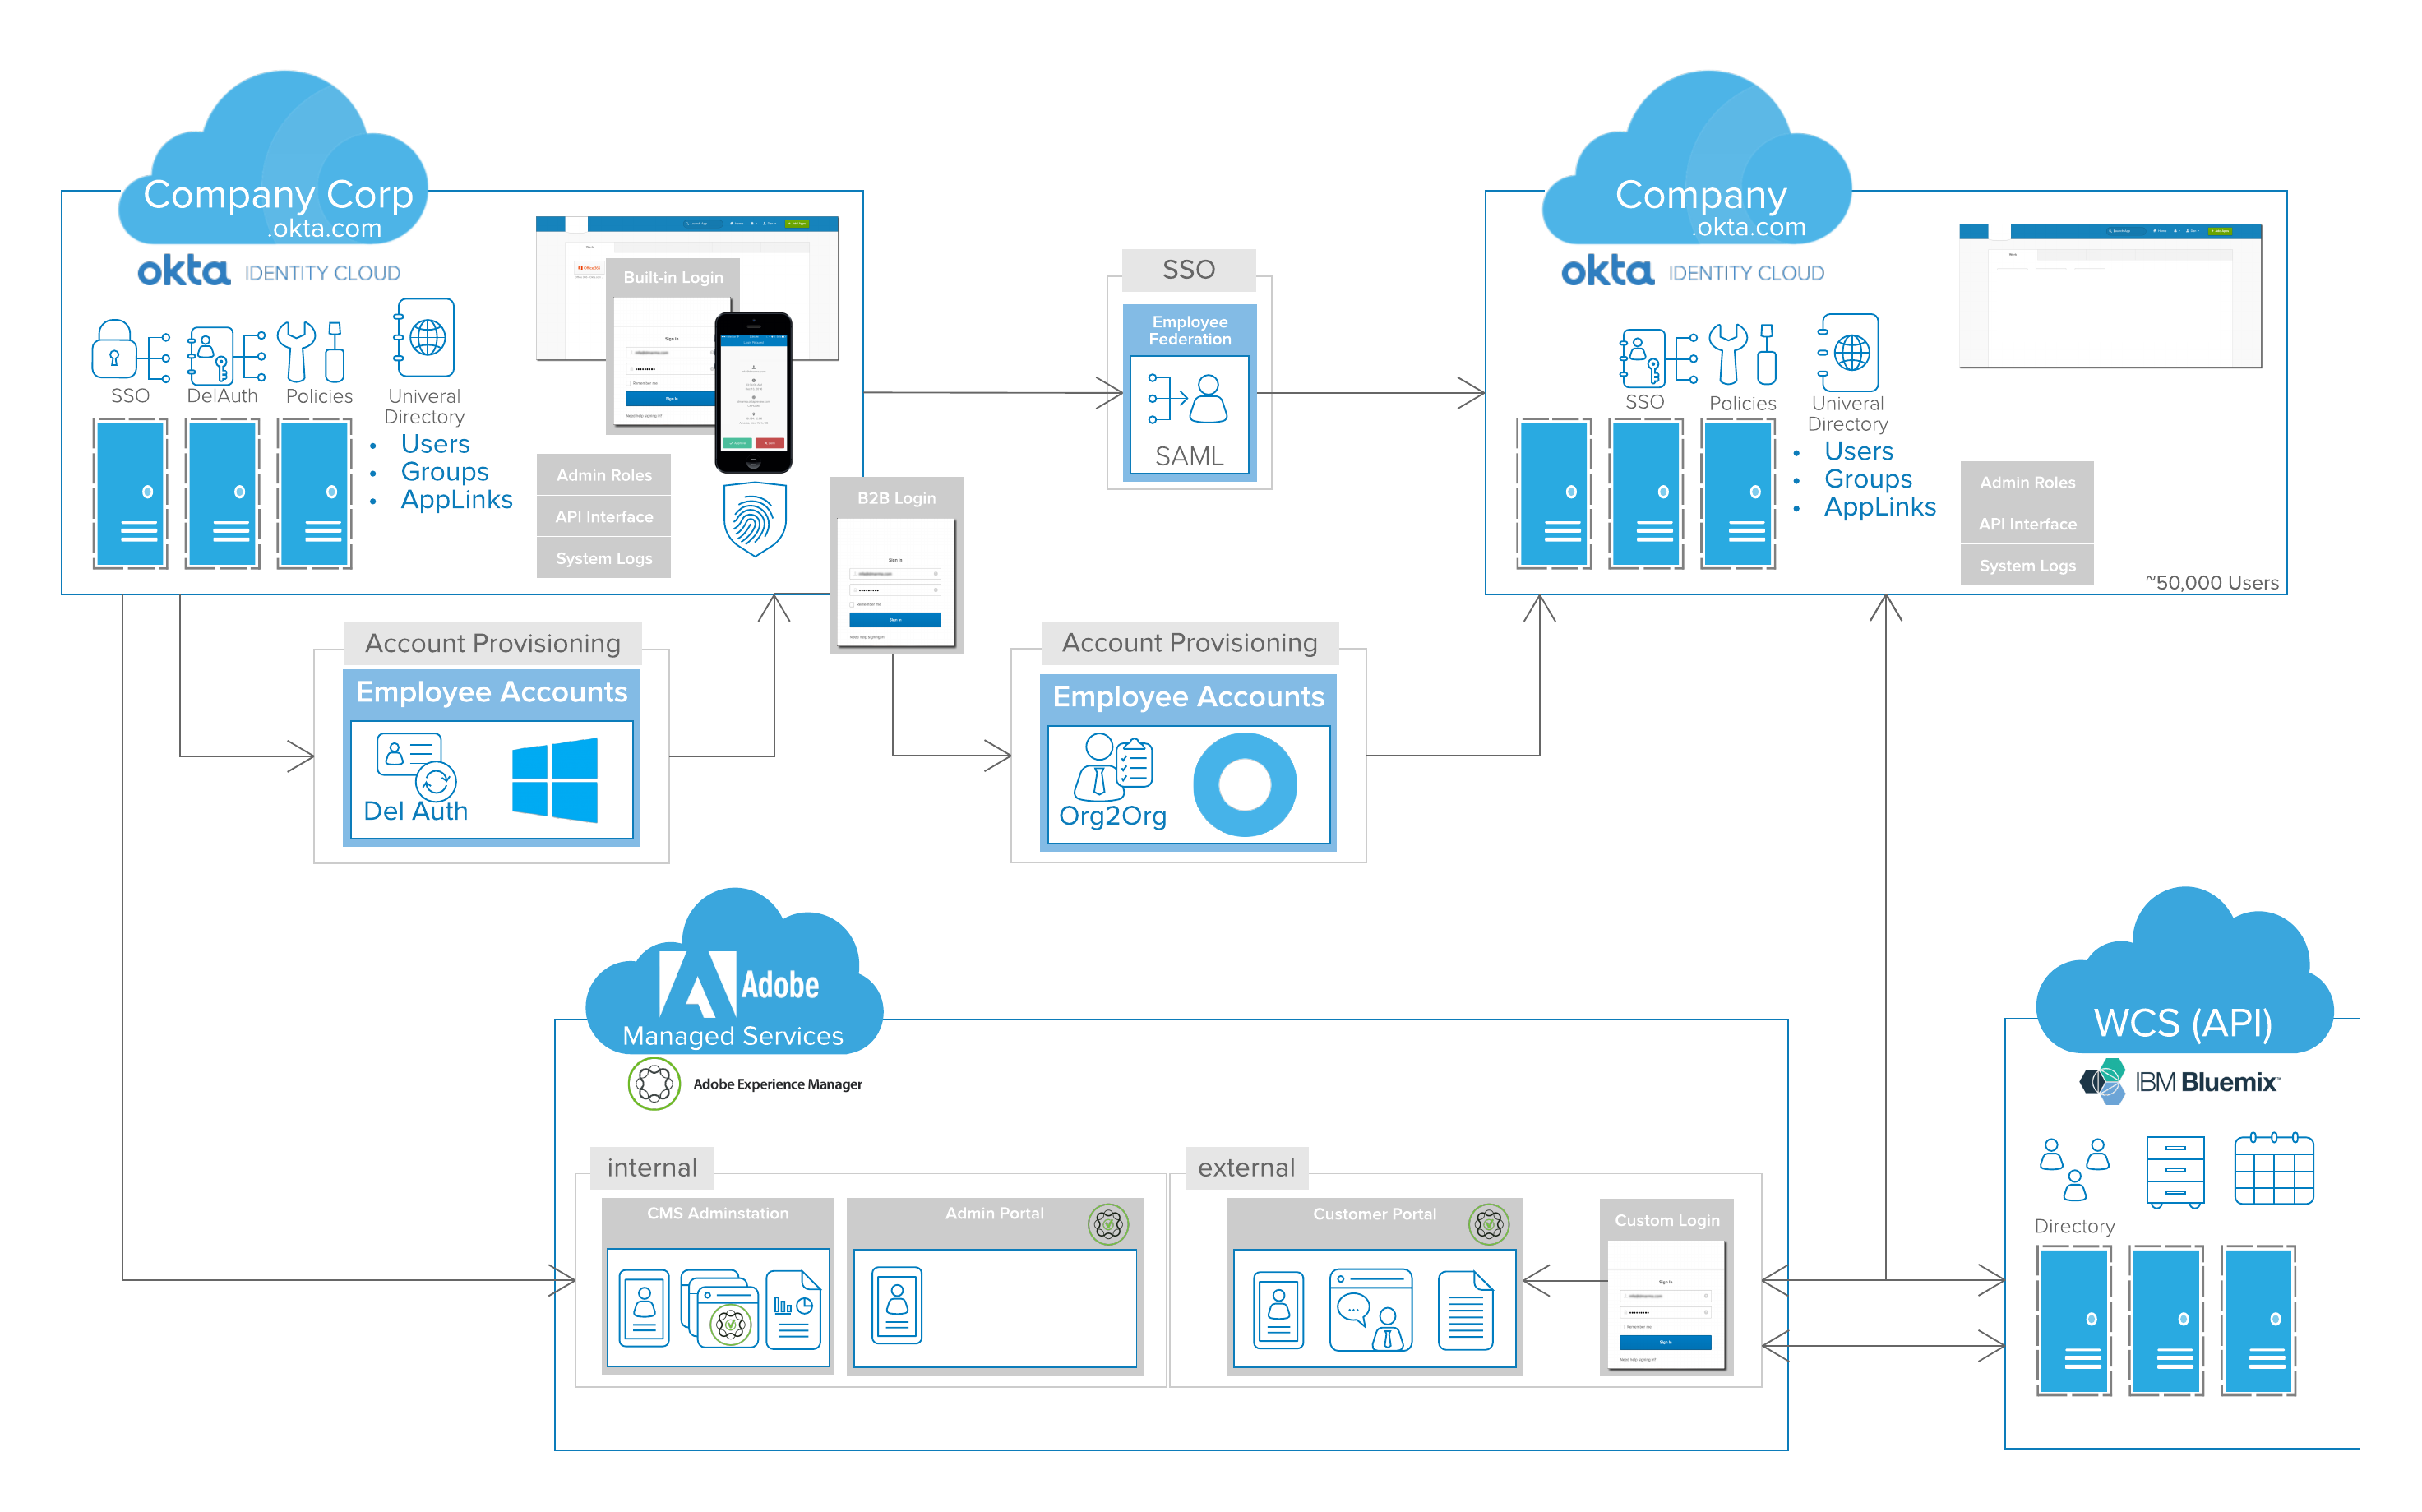
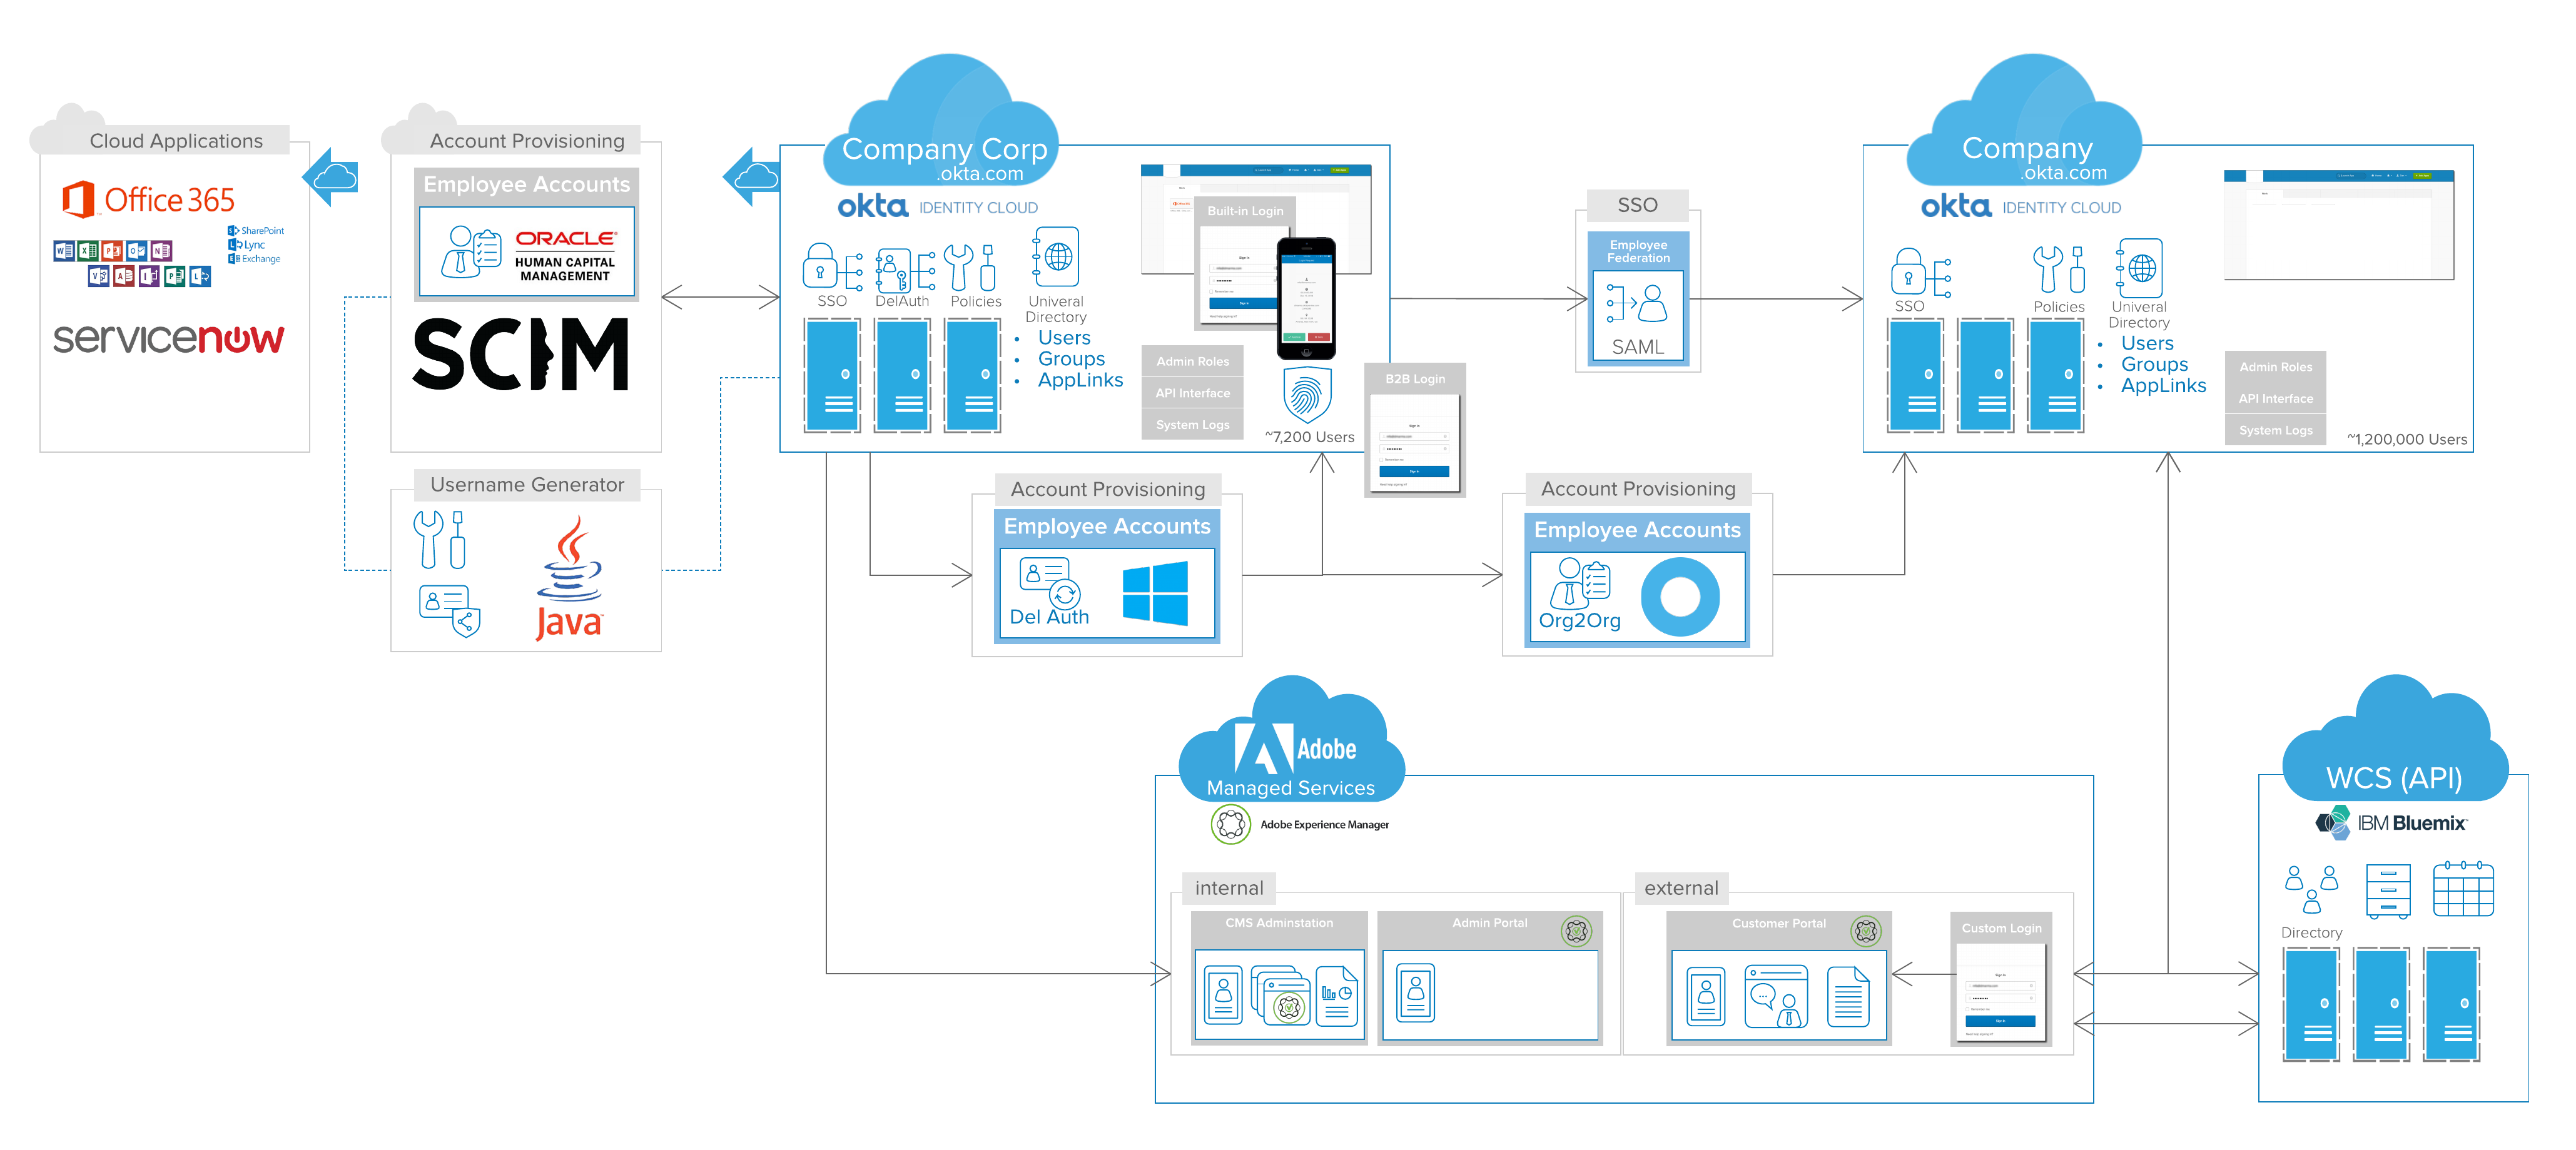
Dan’s job is to bridge that sometimes precarious last gap between pre-sales and a closed deal. He could talk about Okta’s solutions for hours or compose dry novels to send to a customer, but neither are very effective methods. It’s visuals that form the bridge and make the difference. Using Lucidchart diagrams, he can clearly communicate how Okta will connect an organization with its users, suppliers, and partners.
“I find that when we're talking to different people, when I am able to use a diagram to show how Okta would work for their particular use case, it starts to click so much better than me just trying to articulate on the phone. Because words are very dry and are open to too much interpretation,” Dan explains.

Building an arsenal of templates to streamline visual creation
In order to gather the technical information needed to create these diagrams, Dan gets on the phone with or visits a customer. While the customer talks and whiteboards, Dan uses Lucidchart as both a notepad and a virtual whiteboard. By the time a customer has finished a rough whiteboard sketch, Dan has a professional-looking Lucidchart diagram.
Dan is able to build his Lucidchart diagrams so quickly because he has an impressive template repository. In fact, his template library has made him famous at Lucid. His folders contain hundreds of scraped diagrams from previous customer calls. As soon as he understands a customer’s situation, he can pull the appropriate template from his library and manipulate it on the fly as the customer provides specific details. All he has to do is drag and drop additional shapes, move shapes around, or change text to create a customized solution. Dan says he can’t emphasize enough the power of having this repository of diagrams already in place.

This library also allows Dan to share best practices with his team. His colleagues all have access to this template collection, which means they can draw on the different diagrams for their own calls. Since the diagrams have all been converted to templates, Dan doesn’t have to worry about the original versions being touched.
Thanks to these templates and Lucidchart’s ease of use, Dan’s diagrams are not only created quickly but also designed beautifully — which can be key for sealing the deal.
“The diagrams not only have to be valid, but they also have to look sharp because we're still in that pre-honeymoon phase. We're in a dating phase. You know, we don't want to look like ‘oh man, this guy is just kind of taking his Crayola crayons and trying to put this together.’ You know, make it look solid,” Dan describes.
Collaborating with customers in real time
The beauty of this virtual whiteboard is that Dan and the customer can walk through a diagram in real time. Rather than sending versions back and forth, Dan does a screenshare so the customer can literally watch him build a diagram. He can gather and implement feedback immediately in order to ensure all technical information is accurate.
With Lucidchart, Dan can create a diagram for nearly every occasion. His collection includes network diagrams, sequence diagrams, wireframes, data models, and timelines.
“I use Lucidchart whenever words don't paint the picture, from architecture design to network topology to timelines,” he says.
In one instance, a customer didn’t understand how a third-party implementation would work with Okta’s solution. Dan had a sequence diagram but needed to provide further clarification. He built wireframes to show what would happen screen by screen, demonstrating how Okta would cut down the time each event required. According to Dan, this visual “drove the story home.”
“It accelerated the project forward because people could say, ‘Oh, this is what we’re expecting.’ Before, I felt like I was literally sitting in a mud box spinning my wheels. I switched over to the storyboard I created in Lucidchart, and we got traction and flew. The customer was no longer confused about what was going to happen,” Dan recalls.

Dan uses Lucidchart to map out the customer journey when a client is unclear what the end user experience will look like. He builds timelines to outline when specific milestones need to happen to hit a target launch date, helping to accelerate the sales process and keep everyone on the same page.

Presenting deliverables the way the customer wants them
Once Dan has diagrams he and the customer agree on, it’s time to present them to stakeholders. Dan knows his customers prefer to consume information in Microsoft Word or PowerPoint documents. All he has to do is export his diagrams as PNGs and add them to existing documentation. Using Lucidchart’s Microsoft integration, he can even directly embed diagrams in Word, PowerPoint, or Excel without leaving the Microsoft application.
Passing the baton to implementation
Even after Dan has successfully closed the deal, his trusty diagrams live on. He adds layers of detail to them to help sales architects and others who push the buttons on implementation. The Okta team creates a formal design document, which can be anywhere from 50- to 120-pages long and contains intricate details on the existing architecture, visuals, and code. Customers, architects, and designers all refer to the document.

Reaping the rewards
According to Dan, without these visuals, he could not build customers’ trust as quickly, especially virtually. When he’s meeting a customer for the first time, it’s like a date—he knows they are scoping him out to see if he really knows what he is talking about and if the product will actually solve their need. Being able to provide professional diagrams so quickly puts them at ease.
And that’s why if you ask Dan what he uses Lucidchart for, he’ll tell you the better question is what doesn’t he use it for. Dan lives up to his name as Okta’s main wingman—one deal and one diagram at a time.
About Lucidchart
Lucidchart, a cloud-based intelligent diagramming application, is a core component of Lucid Software's Visual Collaboration Suite. This intuitive, cloud-based solution empowers teams to collaborate in real-time to build flowcharts, mockups, UML diagrams, customer journey maps, and more. Lucidchart propels teams forward to build the future faster. Lucid is proud to serve top businesses around the world, including customers such as Google, GE, and NBC Universal, and 99% of the Fortune 500. Lucid partners with industry leaders, including Google, Atlassian, and Microsoft. Since its founding, Lucid has received numerous awards for its products, business, and workplace culture. For more information, visit lucidchart.com.
Related articles
Announcing Lucidchart for Sales
We're excited to announce Lucidchart for Sales - new resources and templates to help teams use Lucidchart to accelerate the sales process.
7 strategies for writing a winning sales proposal
Demonstrate the ROI of your product or service and close bigger deals faster when you create a winning sales proposal for prospective clients. Learn 7 tips for drafting the perfect proposal, such as customizing your templates and incorporating visuals.

