How to create rack diagrams free
Lucid Content
Reading time: about 3 min
Lucidchart is committed to offering our users the option to make any diagram they need, from nearly any category. One of the convenient shape libraries we provide is for creating server rack diagrams. Continue reading to learn how you can create a rack diagram for free with Lucidchart.
1. Identify physical components
Before you begin, identify the physical components you will be organizing in your diagram. Will you be using one rack, or several? What kind of equipment will you be using? What are the measurements of components you are organizing? Having this information on hand will be helpful when you are creating your diagram.
2. Create a Lucidchart account
If you don’t have one already, create an account with Lucidchart by heading over to the registration page and choosing the account type that best suits your needs. Server racks are available on the free version, but choose the Pro or Team edition for more shape libraries and increased storage space.
3. Turn on the server rack shape library
Once you have created a Lucidchart document, click on “More shapes” and turn on the server rack shape library. Alternatively, create a new document, choose the “Network Infrastructure Category” and select the “Server Rack” template. This will take you to a document template with an existing filled-out server rack; you can then add to or subtract from it.
4. Drag out shapes and resize
Once you have started working in the server rack library, you can drag out the shapes you need to build out your diagram. First, drag out the main server rack shape, then add the elements that will be located on your rack. The purpose of a server rack diagram is to organize exactly how much space each element will take up, so make sure that everything is sized to exact scale. Lucidchart makes it easy to resize components because when you drag the corners to change the shape, a window appears to let you know in real-time how the size is changing.
5. Label your diagram
Label each element on the rack appropriately, since it will serve as a map for the live components. If you choose to use an existing template, be sure that you customize the labels so it’s clear to your team the exact elements you are referring to.
6. Review
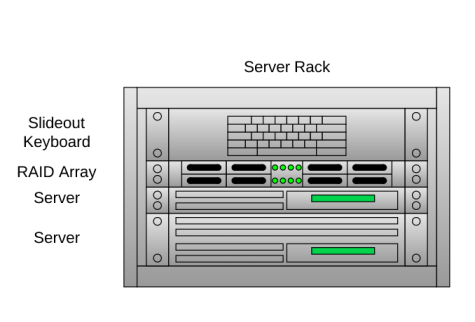
After you have finished your rack diagram, go back over your work to make sure it’s correct. Double-check that everything is to scale, that you’ve chosen equipment that matches your original list, and that you don’t have any errors in your labels. Then, have another member of your team look over it for any inconsistencies. A finished rack diagram should look something like this:
Once you’ve finished assembling your rack diagram, use it as a template to assemble the physical server rack. If you’ve done your job right, having the diagram on hand will help you move the equipment just once, rather than trying to get it all figured out in the middle of the process. Lucidchart makes rack diagrams easy because the shapes are stylized, but not specific to any vendor. Try it today and see how simple it is!
About Lucidchart
Lucidchart, a cloud-based intelligent diagramming application, is a core component of Lucid Software's Visual Collaboration Suite. This intuitive, cloud-based solution empowers teams to collaborate in real-time to build flowcharts, mockups, UML diagrams, customer journey maps, and more. Lucidchart propels teams forward to build the future faster. Lucid is proud to serve top businesses around the world, including customers such as Google, GE, and NBC Universal, and 99% of the Fortune 500. Lucid partners with industry leaders, including Google, Atlassian, and Microsoft. Since its founding, Lucid has received numerous awards for its products, business, and workplace culture. For more information, visit lucidchart.com.
Related articles
Your Ticket to Easier PCI Compliance
Clearly, PCI compliance needs to be part of an organization’s overall security. So why is there such disconnect in so many companies? PCI compliance can be a complicated process that also runs the risk of becoming quickly outdated. So our product development team set out to create Lucidchart Cloud Insights.
Using network diagrams for diagnosis and troubleshooting
Prevent losses and eliminate frustration with a network diagram of your space. With Lucidchart, you’ll be able to pinpoint and resolve the issue.


