Teaching Kids to Code with Lucidchart
Lucid Content
Reading time: about 5 min
Do you ever look back and wish you had learned to code as a kid?
At Alexander Graham Middle School, kids in 7th and 8th grade are already one step ahead when it comes to coding. April Carpenter, a Project Lead the Way Computer Science teacher, helps students with no background in coding learn to write code and build apps that they can deploy to their phones.
Coding for Kids
Writing the code for an app isn’t easy. To make it work, students need to understand what they want their app to do and then decide what types of code will help them achieve those goals.
How do they keep track of it all?
They use Lucidchart — a platform that over 2.5 million students and teachers use to work visually.
These students start their coding projects with the design process:
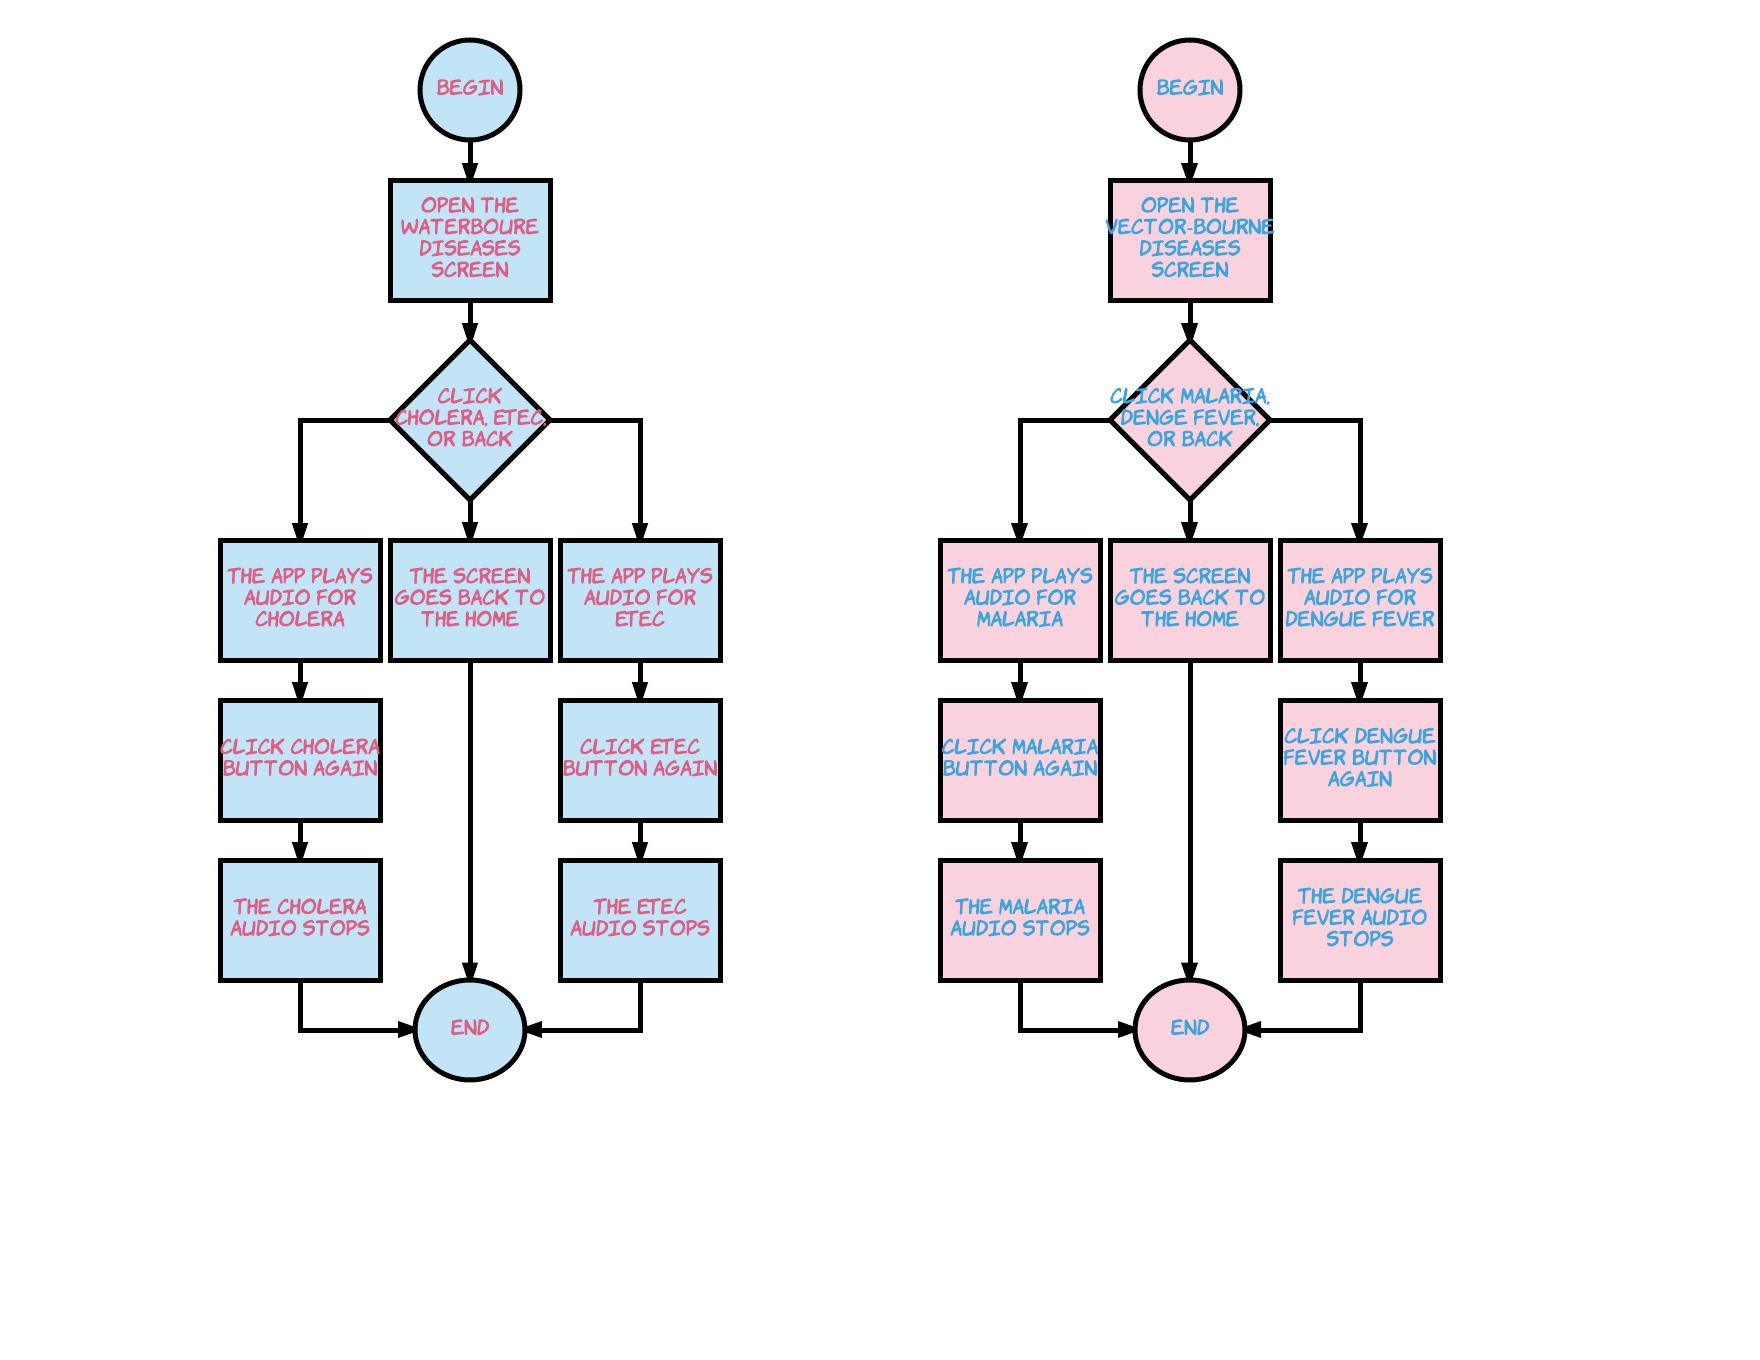
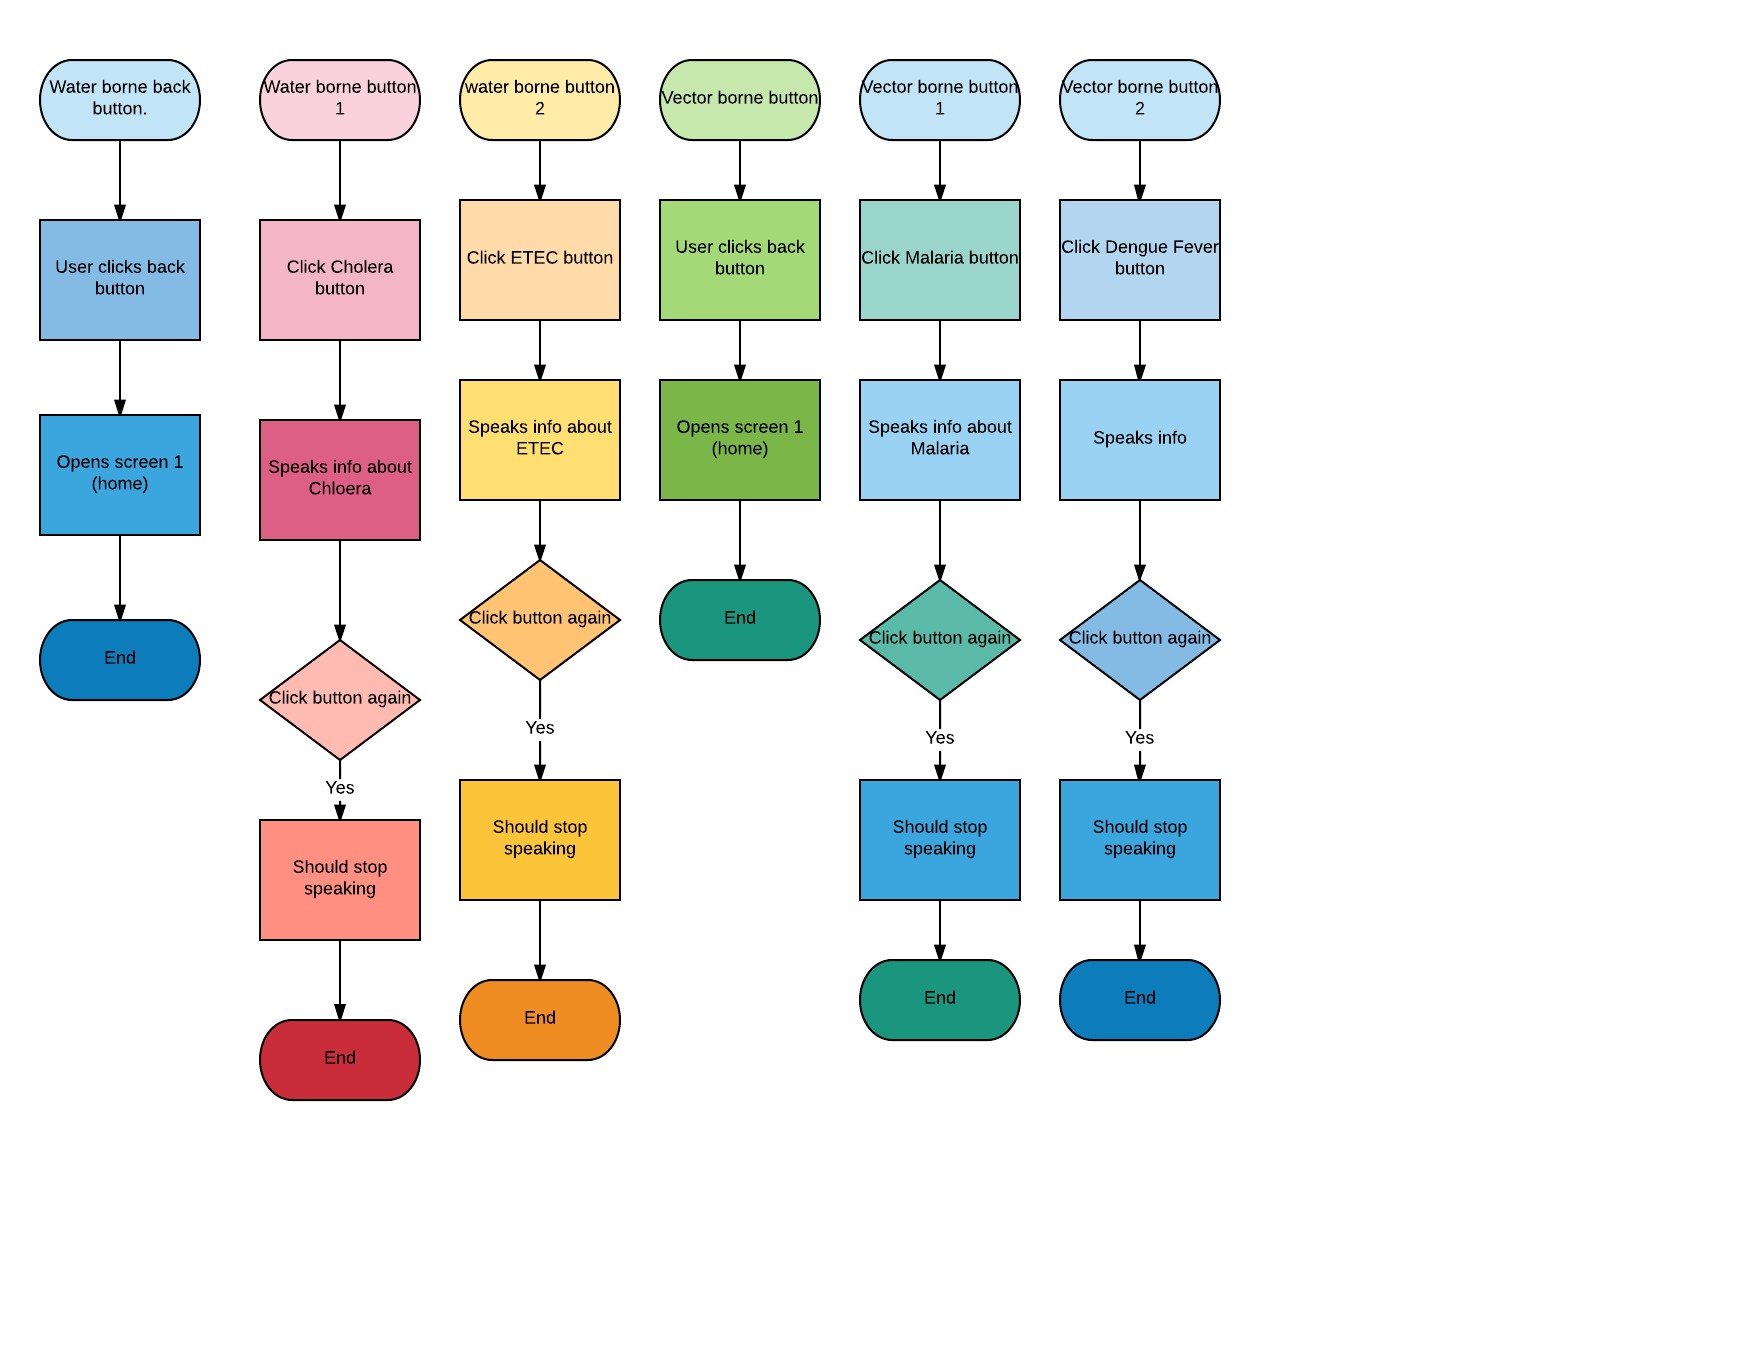
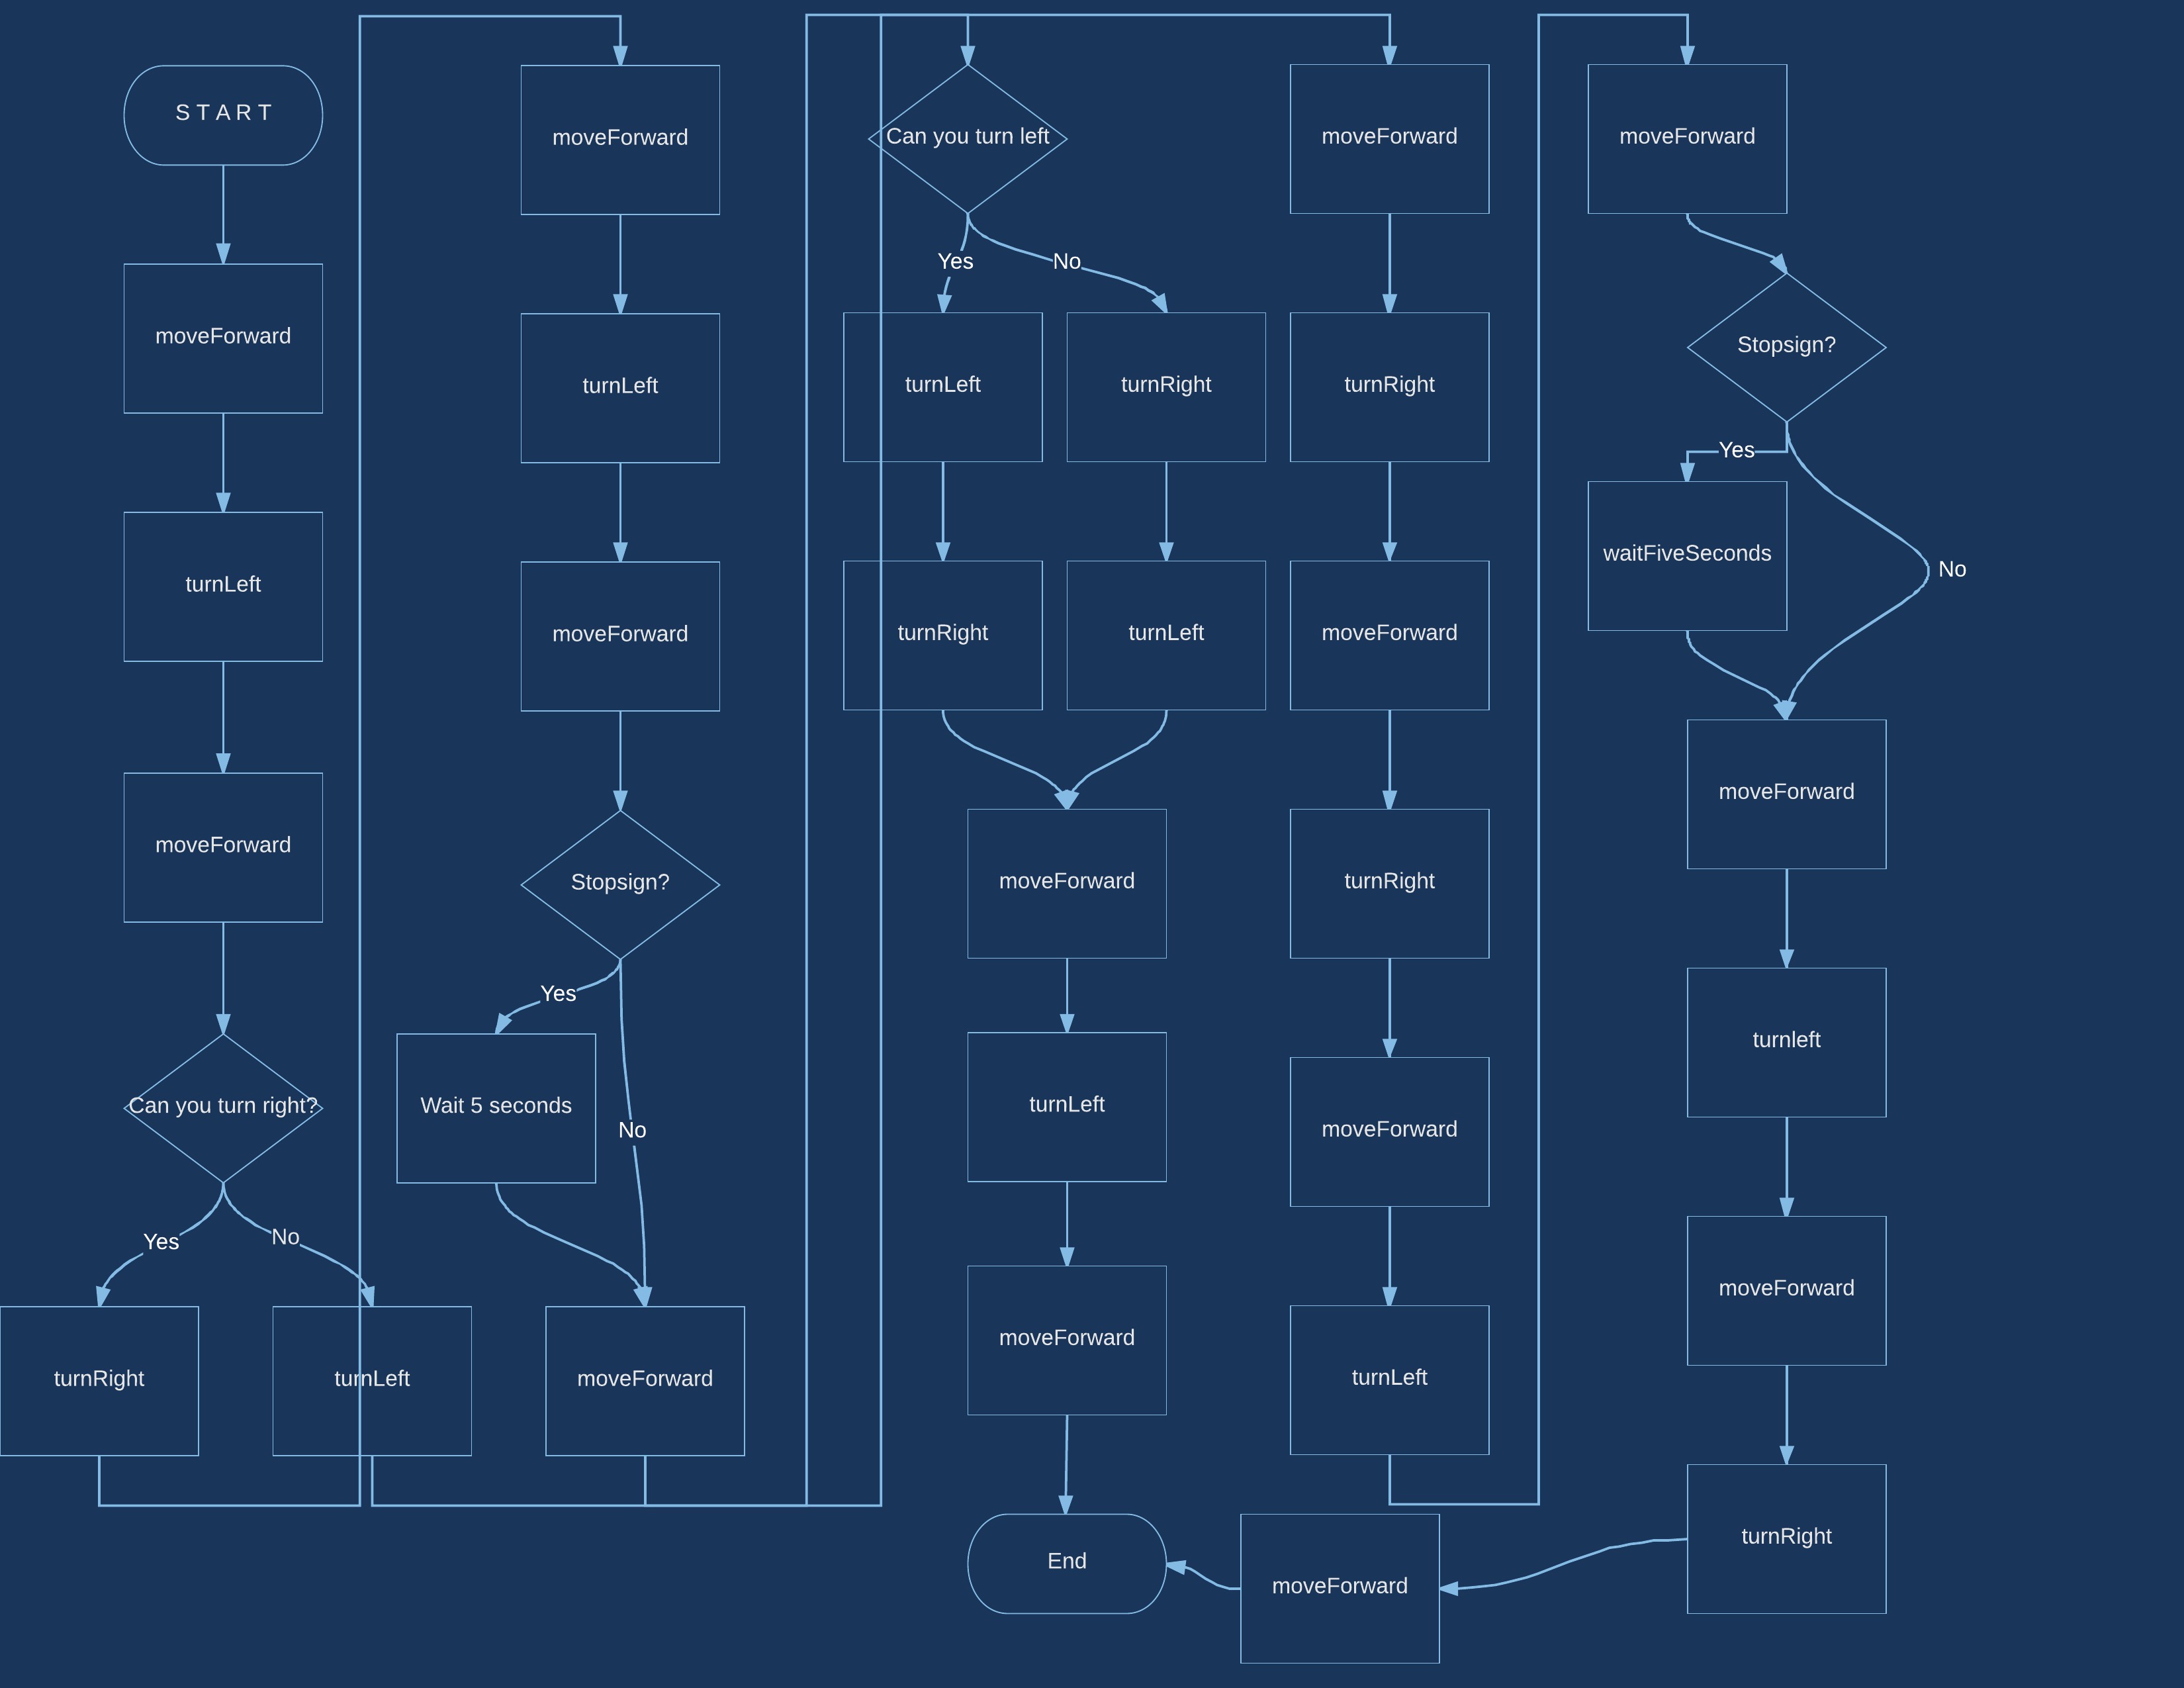
“When my students code, they go through the code design process, discuss their plans with a partner, and then they create flowcharts that show what they want their apps to do,”
Ms. Carpenter describes.

With a Lucidchart diagram, students visualize how a user will flow through their app. They then document:
- The code they plan to write
- The expected outcome for each block of code
- The outcome once they run the code (whether or not it was successful)
- Any fixes they put in place to make it run

With these simple steps, students break down complex coding processes and are able to write code that works.
Troubleshooting code
With so many code elements to keep track of, students need a plan that they can reference when things go wrong.
“We don’t want students to write 100 lines of code, then run it on the computer and have it not work. We write code in increments of 3 to 5 blocks and then go back and check it. When they come to me with a question, the first thing I say is ‘Where’s your flowchart? Let’s go back to what you wrote down and what the code is supposed to be doing.’ That’s what the conversations in our classroom look like.”
With detailed flows and diagrams to refer back to, students can be more independent during the learning process and get their code up and running in no time.

Collaborating in the classroom
One of the other essential skills that Ms. Carpenter helps her students to develop is collaboration. Working with partners, students learn to problem-solve in groups and ask each other for help. This makes for quite the lively classroom:
“It can be pretty noisy in my classroom because kids are constantly collaborating, helping each other to write and troubleshoot code. Lucidchart makes it easy for them to share documents with each other and get feedback.”
With intuitive sharing features and the ability to collaborate in real time, Lucidchart facilitates the collaboration that is so essential for helping students solve tough coding problems together.
Working digitally
Before they started using Lucidchart, students created flowcharts on paper. When papers got lost, as they inevitably tend to do in middle school, it was time-consuming and difficult for students to recreate their thought processes. Sometimes it was also difficult for Ms. Carpenter to decipher the handwriting on the students’ diagrams.
Once students started using Lucidchart, it was almost impossible for them to lose their work, as they always had a copy available on the web that they could access at school or at home. Grading became easier for Ms. Carpenter because, instead of trying to decipher handwriting, students typed the diagrams. Finally, students could submit links to their diagrams directly to Canvas, the school’s grading platform, for Ms. Carpenter to review, creating a seamless handoff and grading process.

Finding intuitive technology
Ms. Carpenter completed a Project Lead The Way training that prepared her to teach classes on innovation, design thinking, and coding. During this training, she learned about several different diagramming applications she could use in her classroom:
“We were given other options that we could use for flowcharting, but they didn't meet my needs. I wanted something that would be simple to use in the classroom and not so complicated that middle schoolers couldn't grasp it. I used Lucidchart to make it easier for my students to build flowcharts and write code together. I didn't even have to explain Lucidchart to them. They got it.”
Instead of spending time training her students to use a more complicated platform, Ms. Carpenter introduced Lucidchart, a platform that so intuitive that her students immediately grasped how to use it.
Achieving lightbulb moments
Ms. Carpenter knows she’s been successful when her students are able to break down complex coding concepts on their own and realize that technology may not have been as intimidating as they thought:
“Some students start this class with the mindset that this is probably not the class for them. It is so exciting to watch students realize ‘I CAN do this’ and some of the thoughts they had when they started subside. You can see them saying, ‘I got it. I like what I’m doing. I can build the code and deploy, then see that it’s working.’ They get so excited, they start talking more about it.”
Lucidchart plays a key role in making these lightbulb moments happen. It makes coding easier because, when students can see exactly what they need to when they go to the computer to write code, they gain confidence in tackling tough coding challenges.
With the lightbulb moments it can create for students, what could Lucidchart do for you? Sign up for a free account to find out.
Start a Lucidchart account for freeAbout Lucidchart
Lucidchart, a cloud-based intelligent diagramming application, is a core component of Lucid Software's Visual Collaboration Suite. This intuitive, cloud-based solution empowers teams to collaborate in real-time to build flowcharts, mockups, UML diagrams, customer journey maps, and more. Lucidchart propels teams forward to build the future faster. Lucid is proud to serve top businesses around the world, including customers such as Google, GE, and NBC Universal, and 99% of the Fortune 500. Lucid partners with industry leaders, including Google, Atlassian, and Microsoft. Since its founding, Lucid has received numerous awards for its products, business, and workplace culture. For more information, visit lucidchart.com.
Related articles
Taking Back the First Day of Class: How to Use Lucidchart to Create Compelling Visual Syllabi
Three different ways to make a syllabus your students will actually pay attention to (plus templates to get started).
Twitter Roundup: Teachers Using Lucidchart in the Classroom
See how teachers have encouraged their students to think visually using Lucidchart, including floor plans based on novels and Spanish grammar flowcharts.
