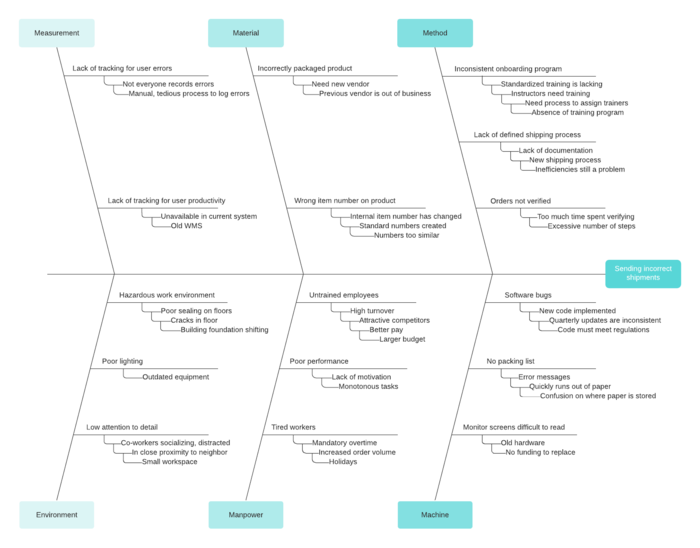
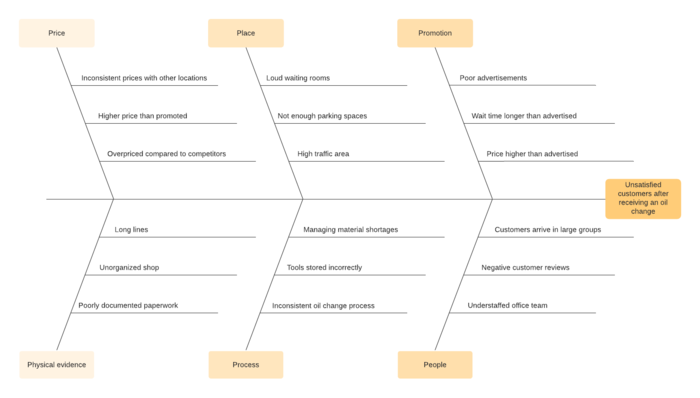
Fishbone diagram maker
Lucidchart is a visual workspace that combines diagramming, data visualization, and collaboration to accelerate understanding and drive innovation.

Quickly analyze cause and effect with our fishbone diagram creator
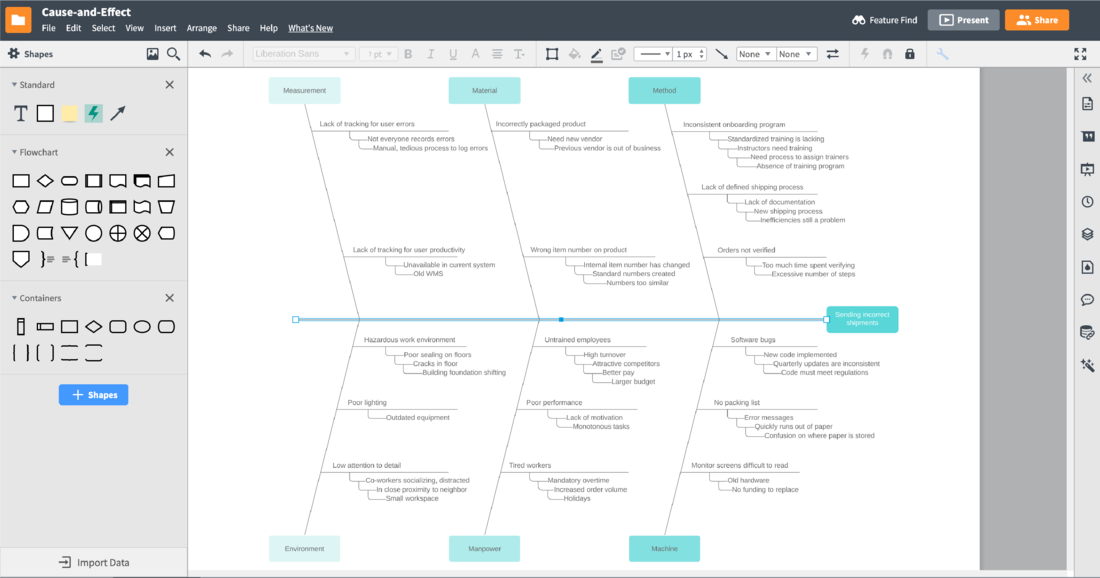
Find the cause of any business problem with effective visuals
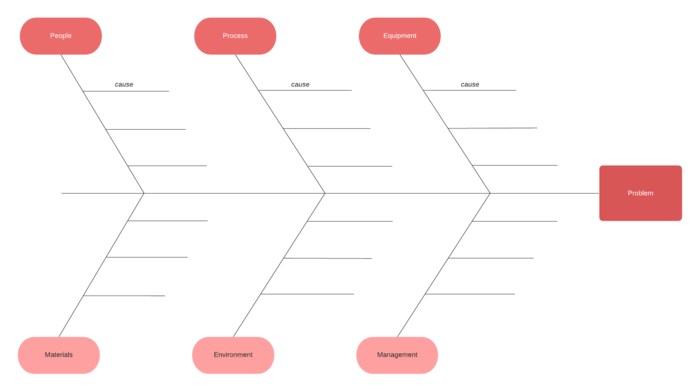
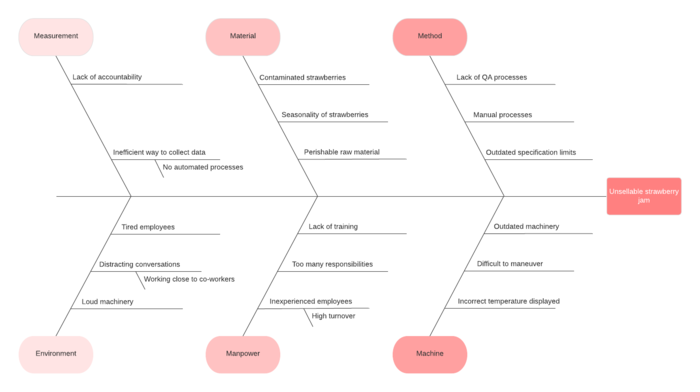
Identify and tackle the root of your problem rather than merely addressing its symptoms with a cause and effect diagram. Commonly referred to as a fishbone diagram, these visuals allow for efficient analysis, pinpointing the root causes of business problems in order to better understand possible solutions. A thorough fishbone diagram can not only help your team collaborate to identify problems, but it can also help you save time and resources as you reduce recurring issues and prioritize realistic solutions.
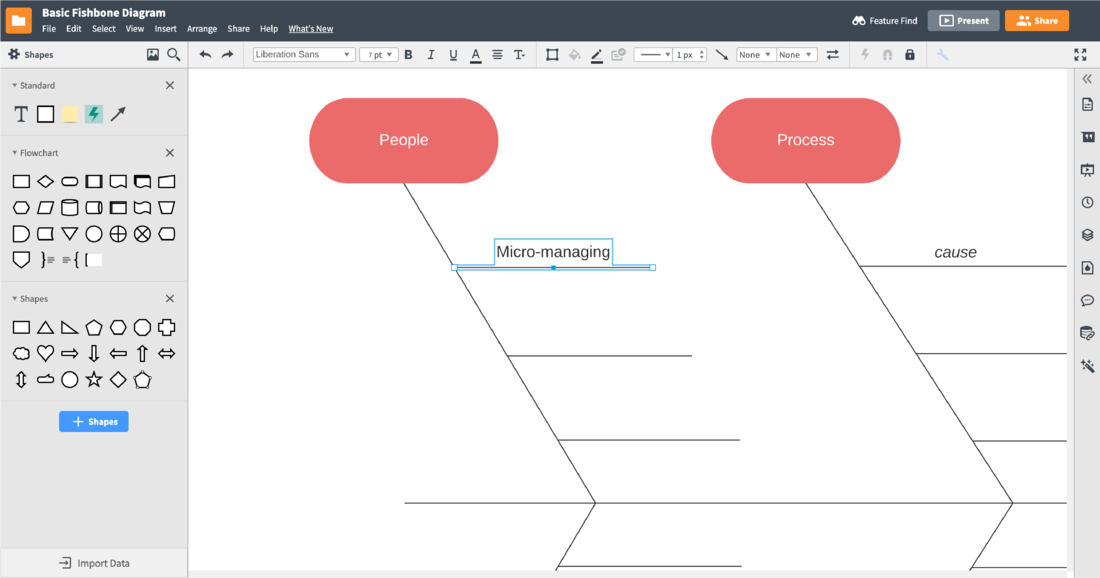
Turn problems into organized solutions with intuitive diagramming tools
Fishbone diagrams require a fair amount of line drawing, spacing, and text. Rather than limit your fishbone diagram to the confines of a whiteboard, Lucidchart allows you the freedom to add as many lines and as much text as you need to identify all possible root causes. Our intuitive fishbone diagram creator makes it easy to add to, group, and format any part of your diagram to keep it clutter-free and professional.
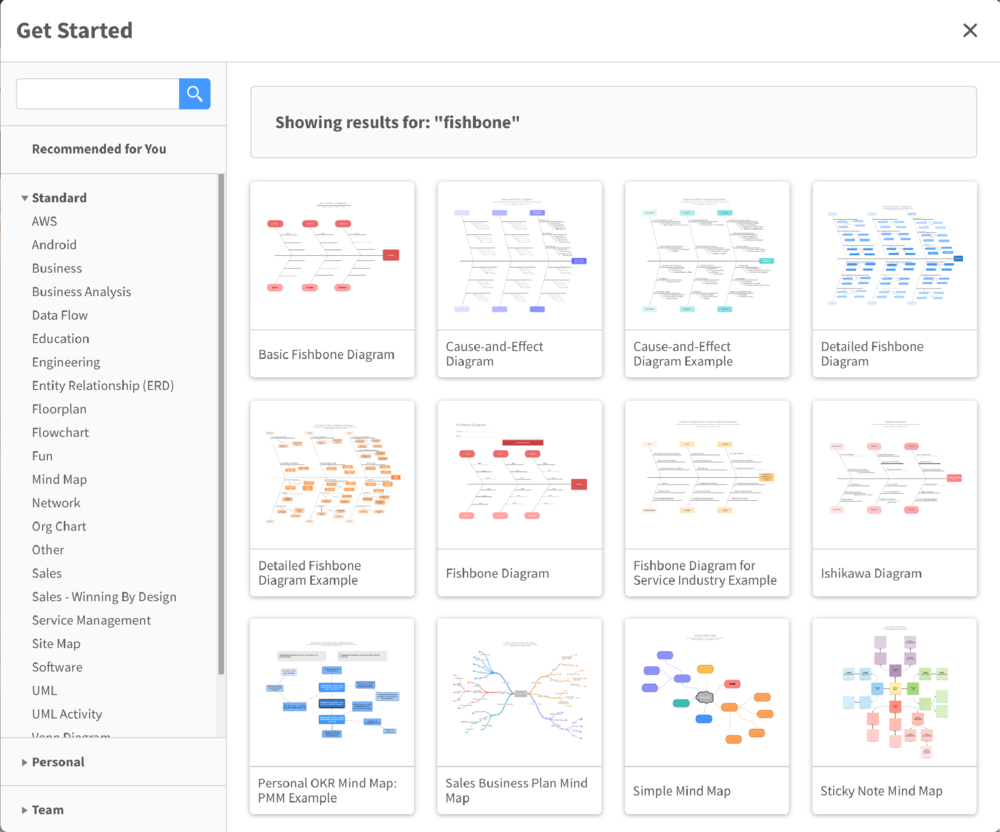
Choose a template to jump-start your brainstorming session
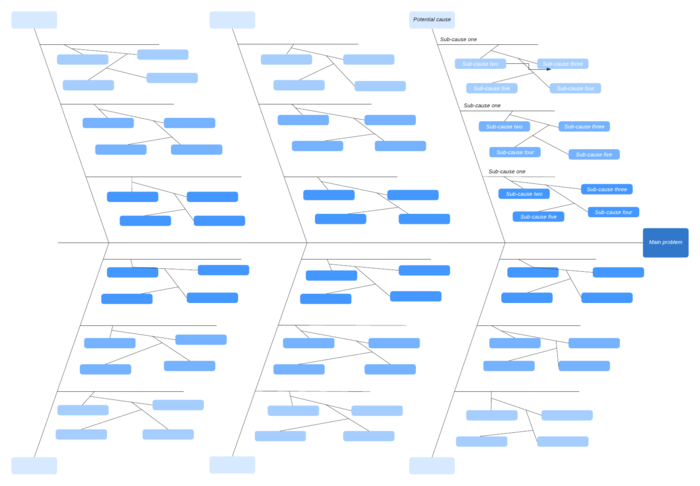
Begin your work in our fishbone diagram maker with inspiration from one of our many fishbone diagram templates. Our templates can help you find an appropriate starting point, provide a framework for your analysis, and highlight possible solutions for your problem. Lucidchart houses more than 800 templates for fishbone diagrams and other brainstorming and analysis diagrams. Lucidchart also lets you create your own templates to share with your team for more standardized brainstorming sessions.
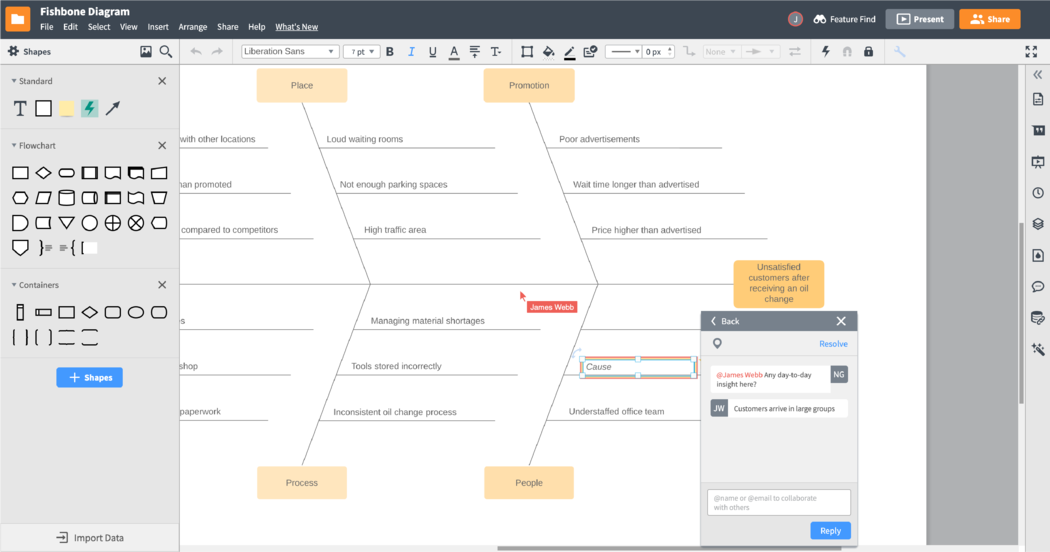
Brainstorm causes as a group in real time
Our fishbone diagram software was built to help you capture your ideas, suggestions, and potentials in order to visualize them easily and accurately. With real-time collaboration, @mention commenting, and in-editor chat functionality built into your Lucidchart canvas, you can analyze and brainstorm with your team without worrying about delays or version control. No matter where your collaborators are located or what device they’re using, you can make sure that your team’s ideas are seamlessly incorporated into your analysis.
How to make a fishbone diagram
Select a template to customize or draw a main line from scratch
Create a horizontal line in the center of your canvas, pointing to the right. This line will act as the “spine” of your fishbone diagram.
Identify the problem
Identify the effect you want to analyze and write it as a problem statement in a box to the right of the center horizontal line.
Create branches from the main arrow for the categories of causes
Identify the major categories of potential causes (such as machines, methods, environment, etc.) and create branches above and below the main arrow line stemming from the problem. Place these categories as headings at the end of these main branches.
Add branches to each category for related causes
Record all possible causes alongside their related category branch. If possible, generate deeper levels of causes by branching any sub-causes from their related causes.
Analyze and assess
Analyze each idea and search for root causes. Review each cause, collectively agree which options should be eliminated, and then prioritize the remaining causes for deeper analysis.
Frequently asked questions about our fishbone diagram software
Lucidchartで楽々プロジェクト管理
Used by millions across the globe
Lucidchart has been a great tool for our team over the years to help colleagues put their ideas and processes into visual form.

4.5/5 stars 650+ reviews
