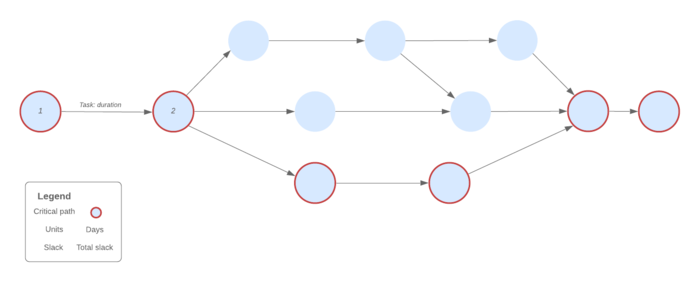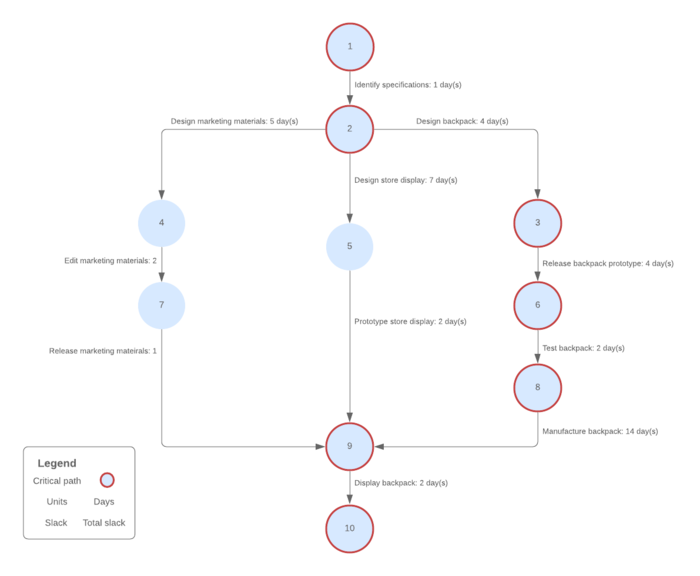
PERT chart generator
Lucidchart is an intelligent diagramming application that makes creating a PERT chart easy with drag-and-drop shapes, ready-to-use templates, and more.
or continue with
By registering, you agree to our Terms of Service and you acknowledge that you have read and understand our Privacy Policy.
Plan and organize projects faster with our PERT chart software
Forecast and communicate the scope of your project
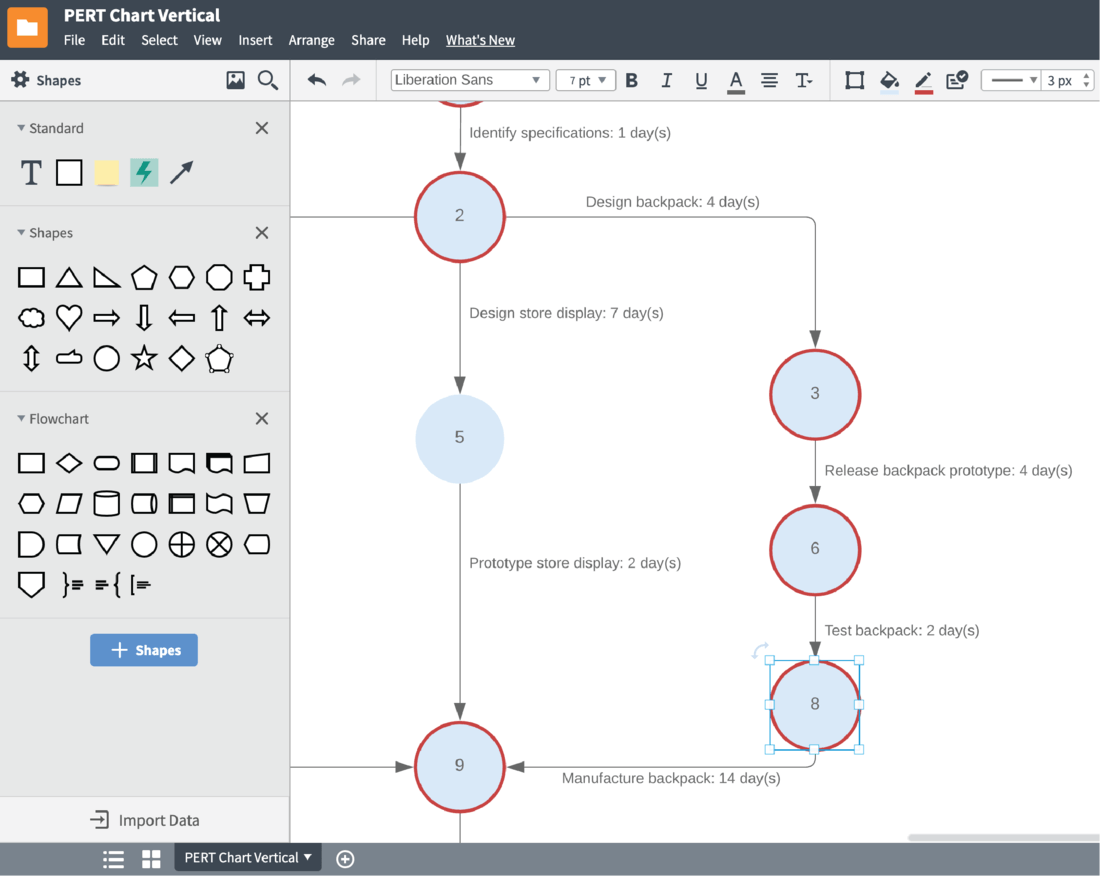
PERT diagrams provide project managers with a realistic idea for how long each stage of their project will take to complete, including the estimated shortest, longest, and most probable timelines for each. Our intuitive PERT chart creator lets you build concise visuals that help you plan, schedule, and coordinate tasks within your project for optimal results.
Hundreds of project management templates
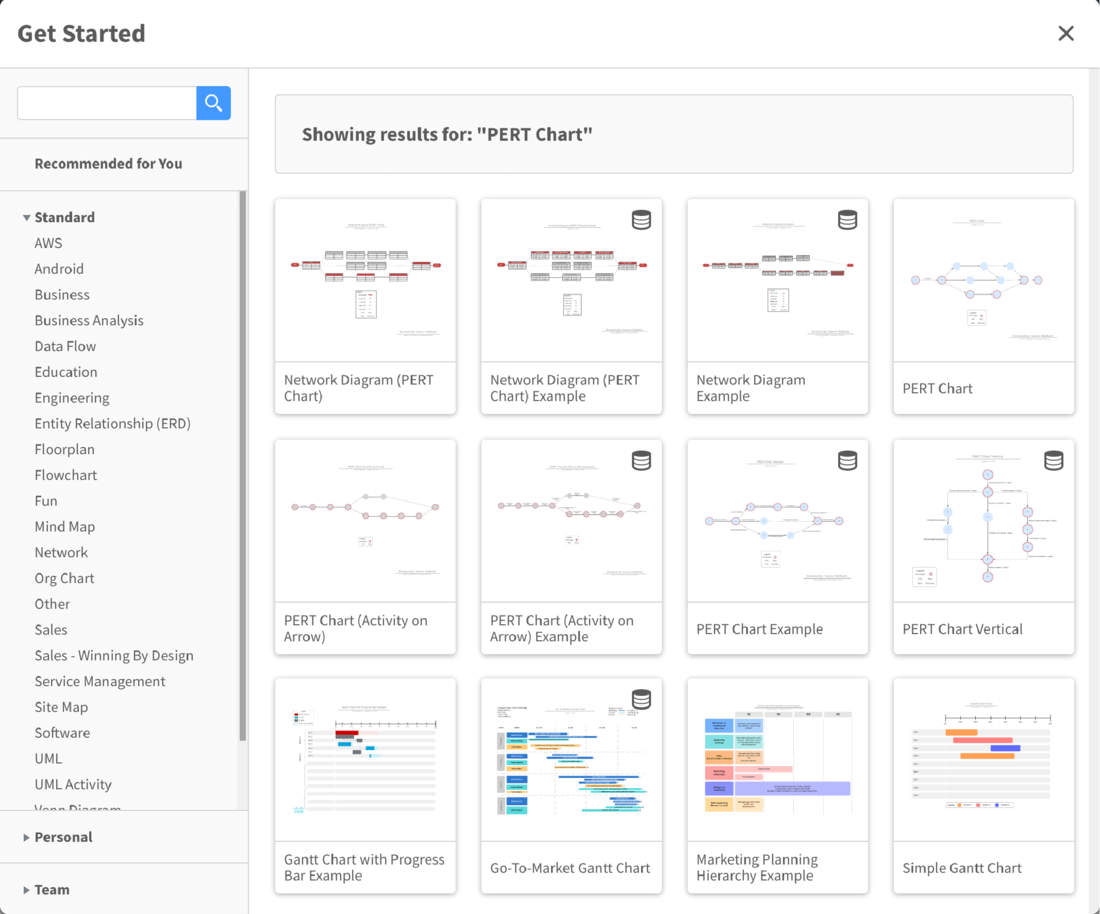
If you’re new to PERT charts or looking for inspiration to better manage projects, our template gallery houses hundreds of examples to get you started. Our PERT chart maker can also provide you with the templates and tools you need to turn your initial PERT diagrams into Gantt charts, Kanban boards, flowcharts, scrum boards, and more as your project evolves.
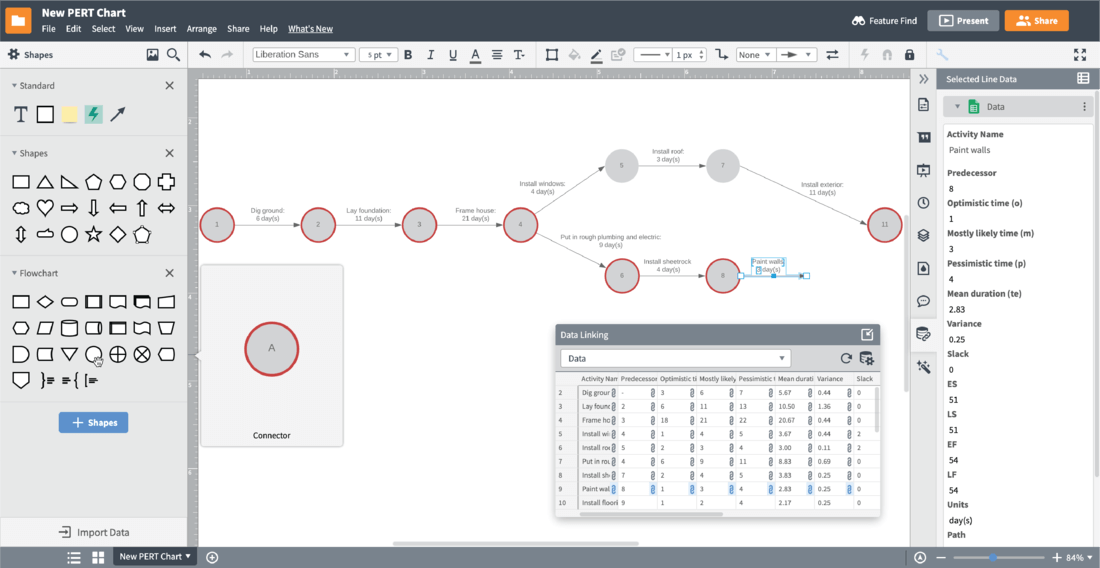
Save time with user-friendly diagramming and formatting tools
PERT charts should save you time, not consume it. Our easy-to-use PERT chart software ensures that you’re able to build your project management visuals quickly and simply. With drag-and-drop shapes, dynamic shape libraries, and time-saving formatting tools, you can create effective, professional PERT charts and other project management diagrams in minutes.
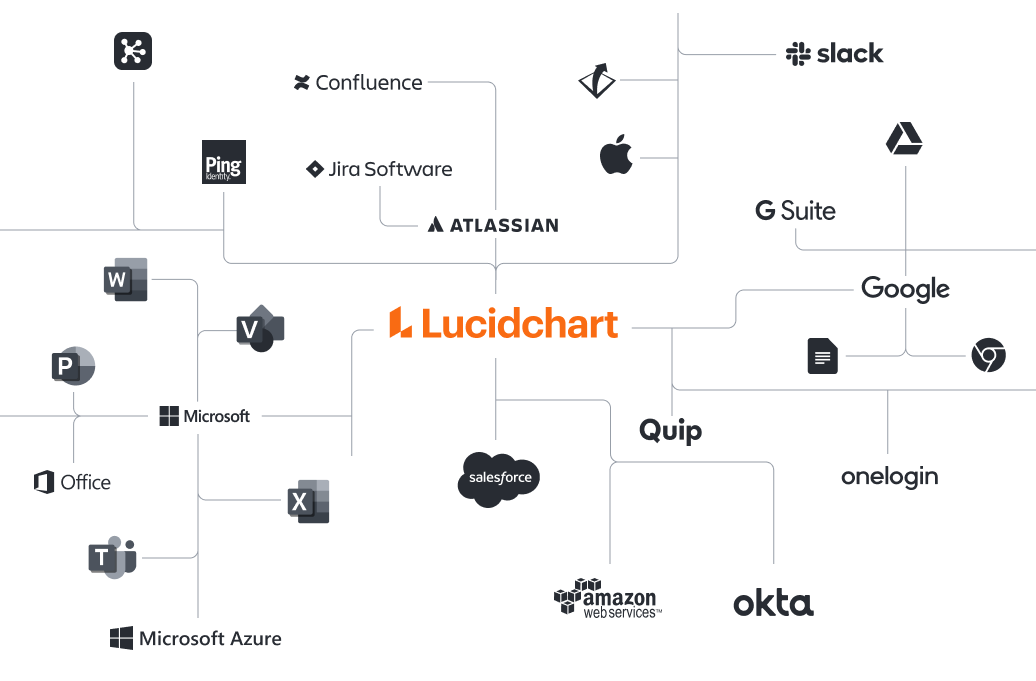
Leverage powerful integrations to promote cooperation and clarity
Our PERT chart generator is fully integrated with the applications you and your team already know and use, like G Suite, Microsoft Office, Confluence, Slack, and more. With powerful integrations, you can insert your PERT diagram and other visuals directly into your preferred platform for added visibility and seamless collaboration.
Master the basics of Lucidchart in 3 minutes
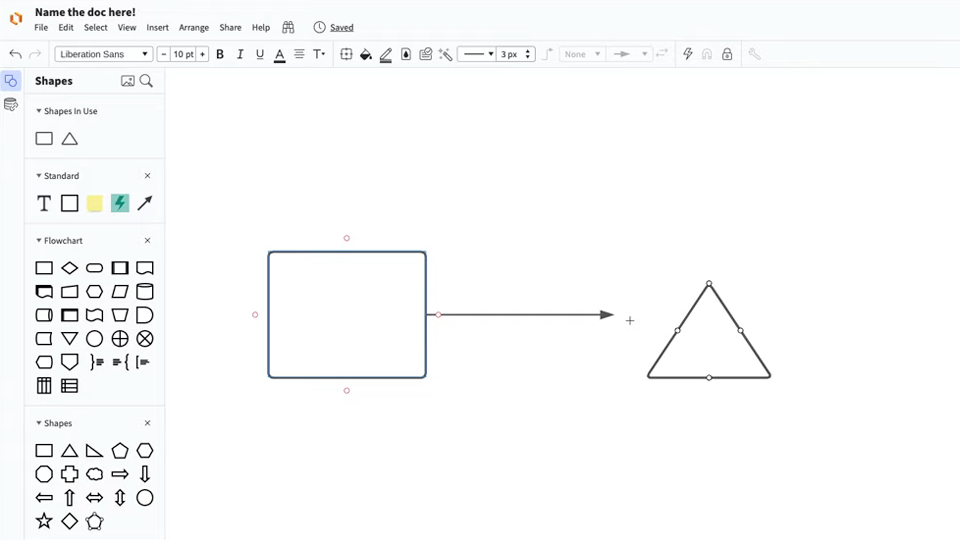
master the basics of Lucidchart in 5 minutes
- Create your first PERT chart from a template or blank canvas or import a document.
- Add text, shapes, and lines to customize your diagram.
- Learn how to adjust styling and formatting.
- Locate what you need with Feature Find.
- Share your diagram with your team to start collaborating.
Lucidchart integrations
Connect Lucidchart to your favorite industry-leading apps.

See why teams choose Lucidchart
Diagram, visualize data, and collaborate all in one platform.

Collaboration
Create online PERT chart diagrams on any device with ease. Lucidchart helps teams collaborate in real time from anywhere in the world. Enhance productivity while working together with your team to achieve your product goals.

Clarity
Lucidchart brings clarity to the complex. Intelligent diagramming allows you to quickly visualize projects and processes from start to finish.
Alignment
Drive alignment with your team by collaborating in the same space. Quickly map out processes and ideas together in real time so that you never miss a beat.

Better Together
The Lucid Visual Collaboration Suite transforms the way you work from ideation to project completion. Brainstorm and plan in Lucidspark then map it out in Lucidchart. Create a living blueprint of your organization.
What is a PERT chart
PERT is an acronym for program evaluation and review technique. A PERT chart is a project management tool used to analyze the individual tasks involved in completing a project. Intended for larger-scale projects, PERT charts are designed to identify the time needed to complete each task, estimating the shortest, longest, and most likely time requirements.

