Data flow diagram software
Lucidchart makes diagramming your data flow simple—no matter how complex your system or process. Try our intuitive data flow diagram software and get to work in minutes.
or continue with
By registering, you agree to our Terms of Service and you acknowledge that you have read and understand our Privacy Policy.
DFDs made easy
Begin working on your DFD online in minutes with our intuitive data flow diagram maker.

Visualize a system
When you map a process or system, you find ways to make it more efficient and effective. Use a data flow diagram to help you improve an existing process or implement a new one.
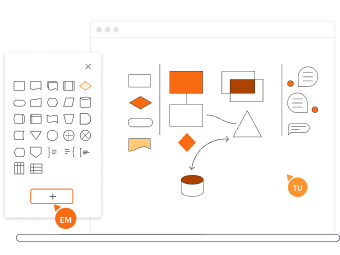
Use the right symbols and notation
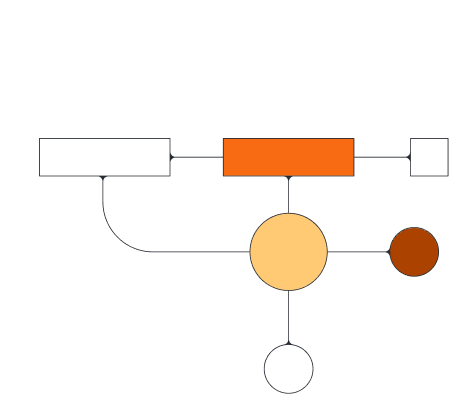
Lucidchart has everything you need for your data flow diagram, including standard symbols for both Gane-Sarson and Yourdon-Coad methodologies. Our shape library for DFDs contains notations for processes, external entities, data stores, and data flows.

Let our advanced features do the work
Our data flow diagram software makes creating large, complex data flow diagrams simple. Lucidchart includes features like conditional formatting, action buttons, external links, and layers. With our help, your diagram will capture all the information you need without becoming busy or hard to follow.

Become an expert right away
Lucidchart is easy to use. Even if you’re just a beginner, our drag-and-drop functionality and simple interface will help you get started in no time. Start your data flow diagram with one of our templates or begin with a blank canvas.

Share and present

Collaborate with your team
Use Lucidchart with anyone, whether you’re in person or remote. You’ll be able to work online from anywhere and collaborate simultaneously on the same document as your team. Use the in-product chat, notes, and comments features to share ideas and give feedback.

Check out our ratings and reviews
Go to third-party apps like G2, TrustRadius, and Capterra to see what other people think. You’ll find thousands of five-star ratings and glowing reviews.
Get to know Lucidchart in 3 minutes
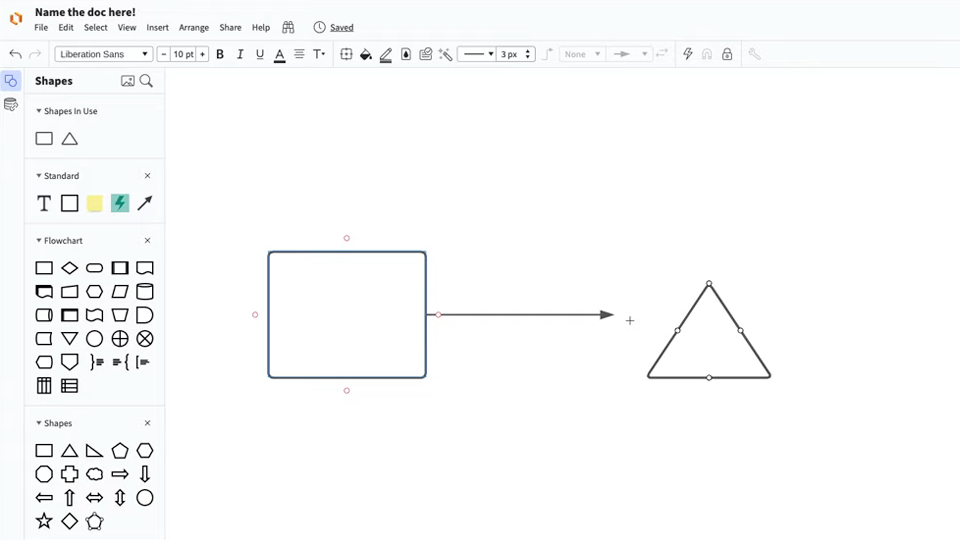
master the basics of Lucidchart in 5 minutes
- Make your first diagram. Import a document, use one of our templates, or start from scratch with a blank canvas.
- Add processes, data stores, external entities, and data flows.
- Locate any feature you need with Feature Find.
- Share your diagram with your team so you can collaborate and get feedback.
Lucidchart integrations
Connect Lucidchart to all your favorite industry-leading apps.

See why teams use Lucidchart as their data flow diagram creator
Diagram, visualize data, and collaborate all in one platform.

Collaboration
Use our data flow diagram software on any device with ease. Lucidchart helps teams collaborate in real time from anywhere in the world. Enhance productivity while working with your team to achieve your goals.
Clarity
Lucidchart brings clarity to the complex. Intelligent diagramming allows you to quickly visualize projects and processes from start to finish.
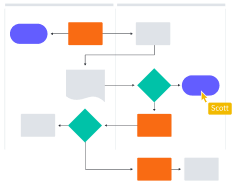
Alignment
Drive alignment with your team by collaborating in the same space. Quickly map out processes and ideas together in real time so that you never miss a beat.

Better together
The Lucid Visual Collaboration Suite transforms the way you work from ideation to project completion. Brainstorm and plan in Lucidspark, then map it out in Lucidchart. Create a living blueprint of your organization.
What is a data flow diagram (DFD)?
Some processes and systems are hard to put into words. A data flow diagram can help. These diagrams visually show the way information flows through systems and processes, including various subprocesses, data stores, and data inputs and outputs. DFDs use standardized symbols and notation to describe various entities and how they are related.
How to make a data flow diagram
Decide your DFD level
Data flow diagrams have a level attached to them that shows how complex they are. The most basic level is 0, and DFDs rarely go beyond level 2 or maybe 3. As you build your diagram, you’ll need to determine the level that makes sense for you.
Identify major inputs and outputs
Every system or process starts with an external entity giving input and ends with outputting data to a database or other entity. Identify your inputs and outputs to get an overview of your process or system.
Build a context diagram
After you’ve identified your major inputs and outputs, draw a context diagram to connect them. Just draw a process node to connect the related entities and show the general way that information flows.
Expand your context diagram
Just one process node doesn’t tell you much. You’ll need to break it down into subprocesses and give more details, though how much detail depends on your diagram’s level.
Expand to a level 2+ DFD
If needed, you can keep adding details to your DFD and increasing its level. Just keep adding more specific subprocesses, ensuring you add necessary data flows and stores along the way.
Confirm your diagram’s accuracy
When you’ve finished drawing your diagram, you’ll need to check it. Walk through it, and pay attention to the flow of information. Ensure it makes sense and that you’ve included all necessary data stores, and you should have no trouble getting other people to understand your diagram as well.

