Enjoy automated data visualization with Lucidchart

Increase productivity
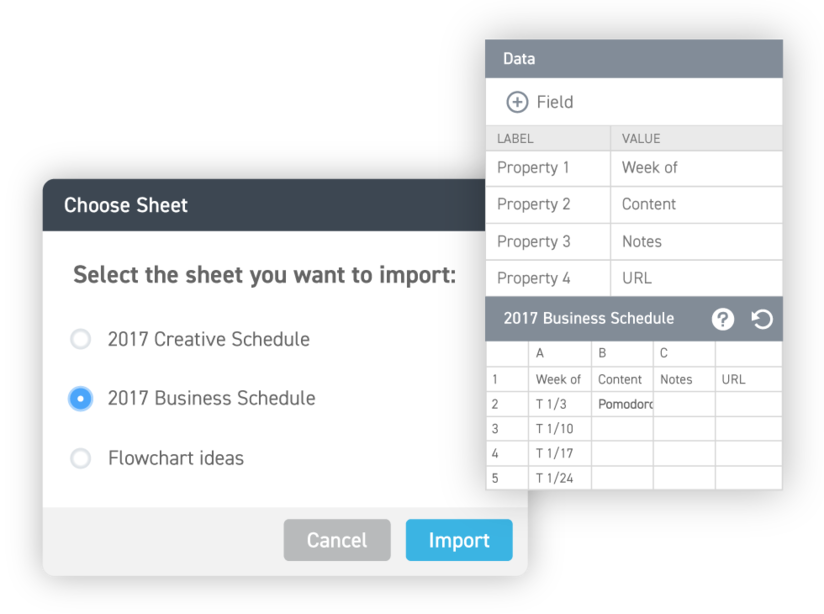
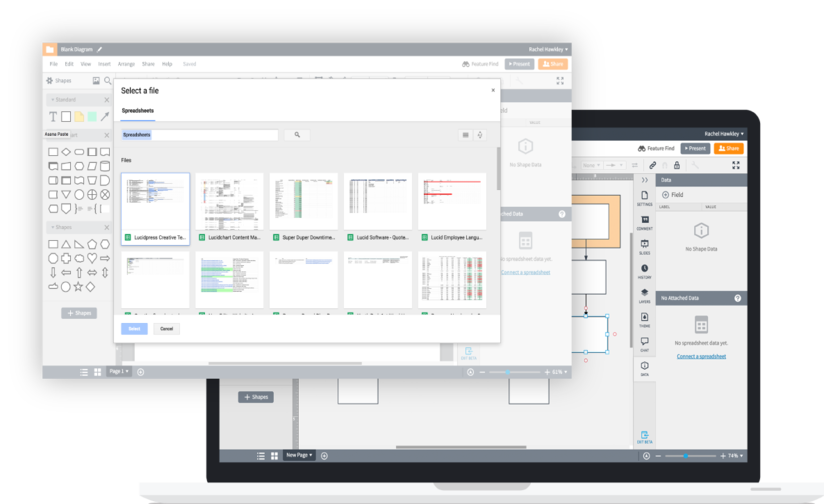
Data linking enables you to spend more time sharing your innovative ideas and less time creating and updating documentation. It’s simple to link diagrams to data stored in Google Sheets or in a CSV file. Every change made to your Google Sheet is immediately reflected in Lucidchart. In addition to reducing the time it takes to update documentation, you’ll also reduce the risk of data entry errors inherent in manually transferring data to your diagram.

Optimize your workflow
Add the power of data linking to your network diagrams, process flow diagrams, floor plans, org charts, and more. Data linking makes it easy to:
- Connect live data to shapes and diagrams.
- Keep documentation up to date.
- Automate ongoing data entry.
- Accurately add data to your diagrams.
- Monitor changes in your data.

Export information to other systems
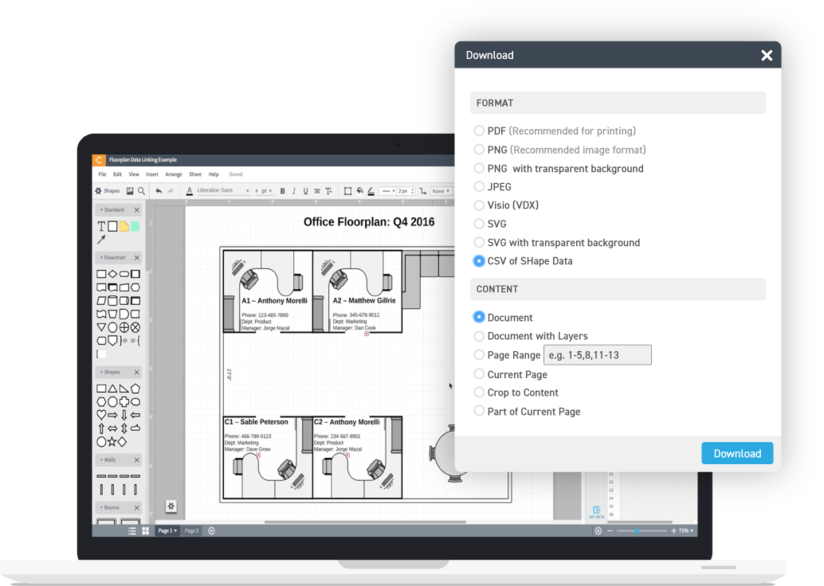
Take your data with you to other work platforms—exporting your data from Lucidchart is simple. In just a few clicks, you can download a CSV of diagram information—including shape name, text fields, and linked data—to use for other projects.
Pearson
The initial momentum behind Lucidchart actually came from the user community.
Pearson used the flexibility of Lucid technology to provide a domain-wide platform for collaboration. Employees support larger goals by using Lucidchart as the place of record for creating, sharing, and publishing important charts.