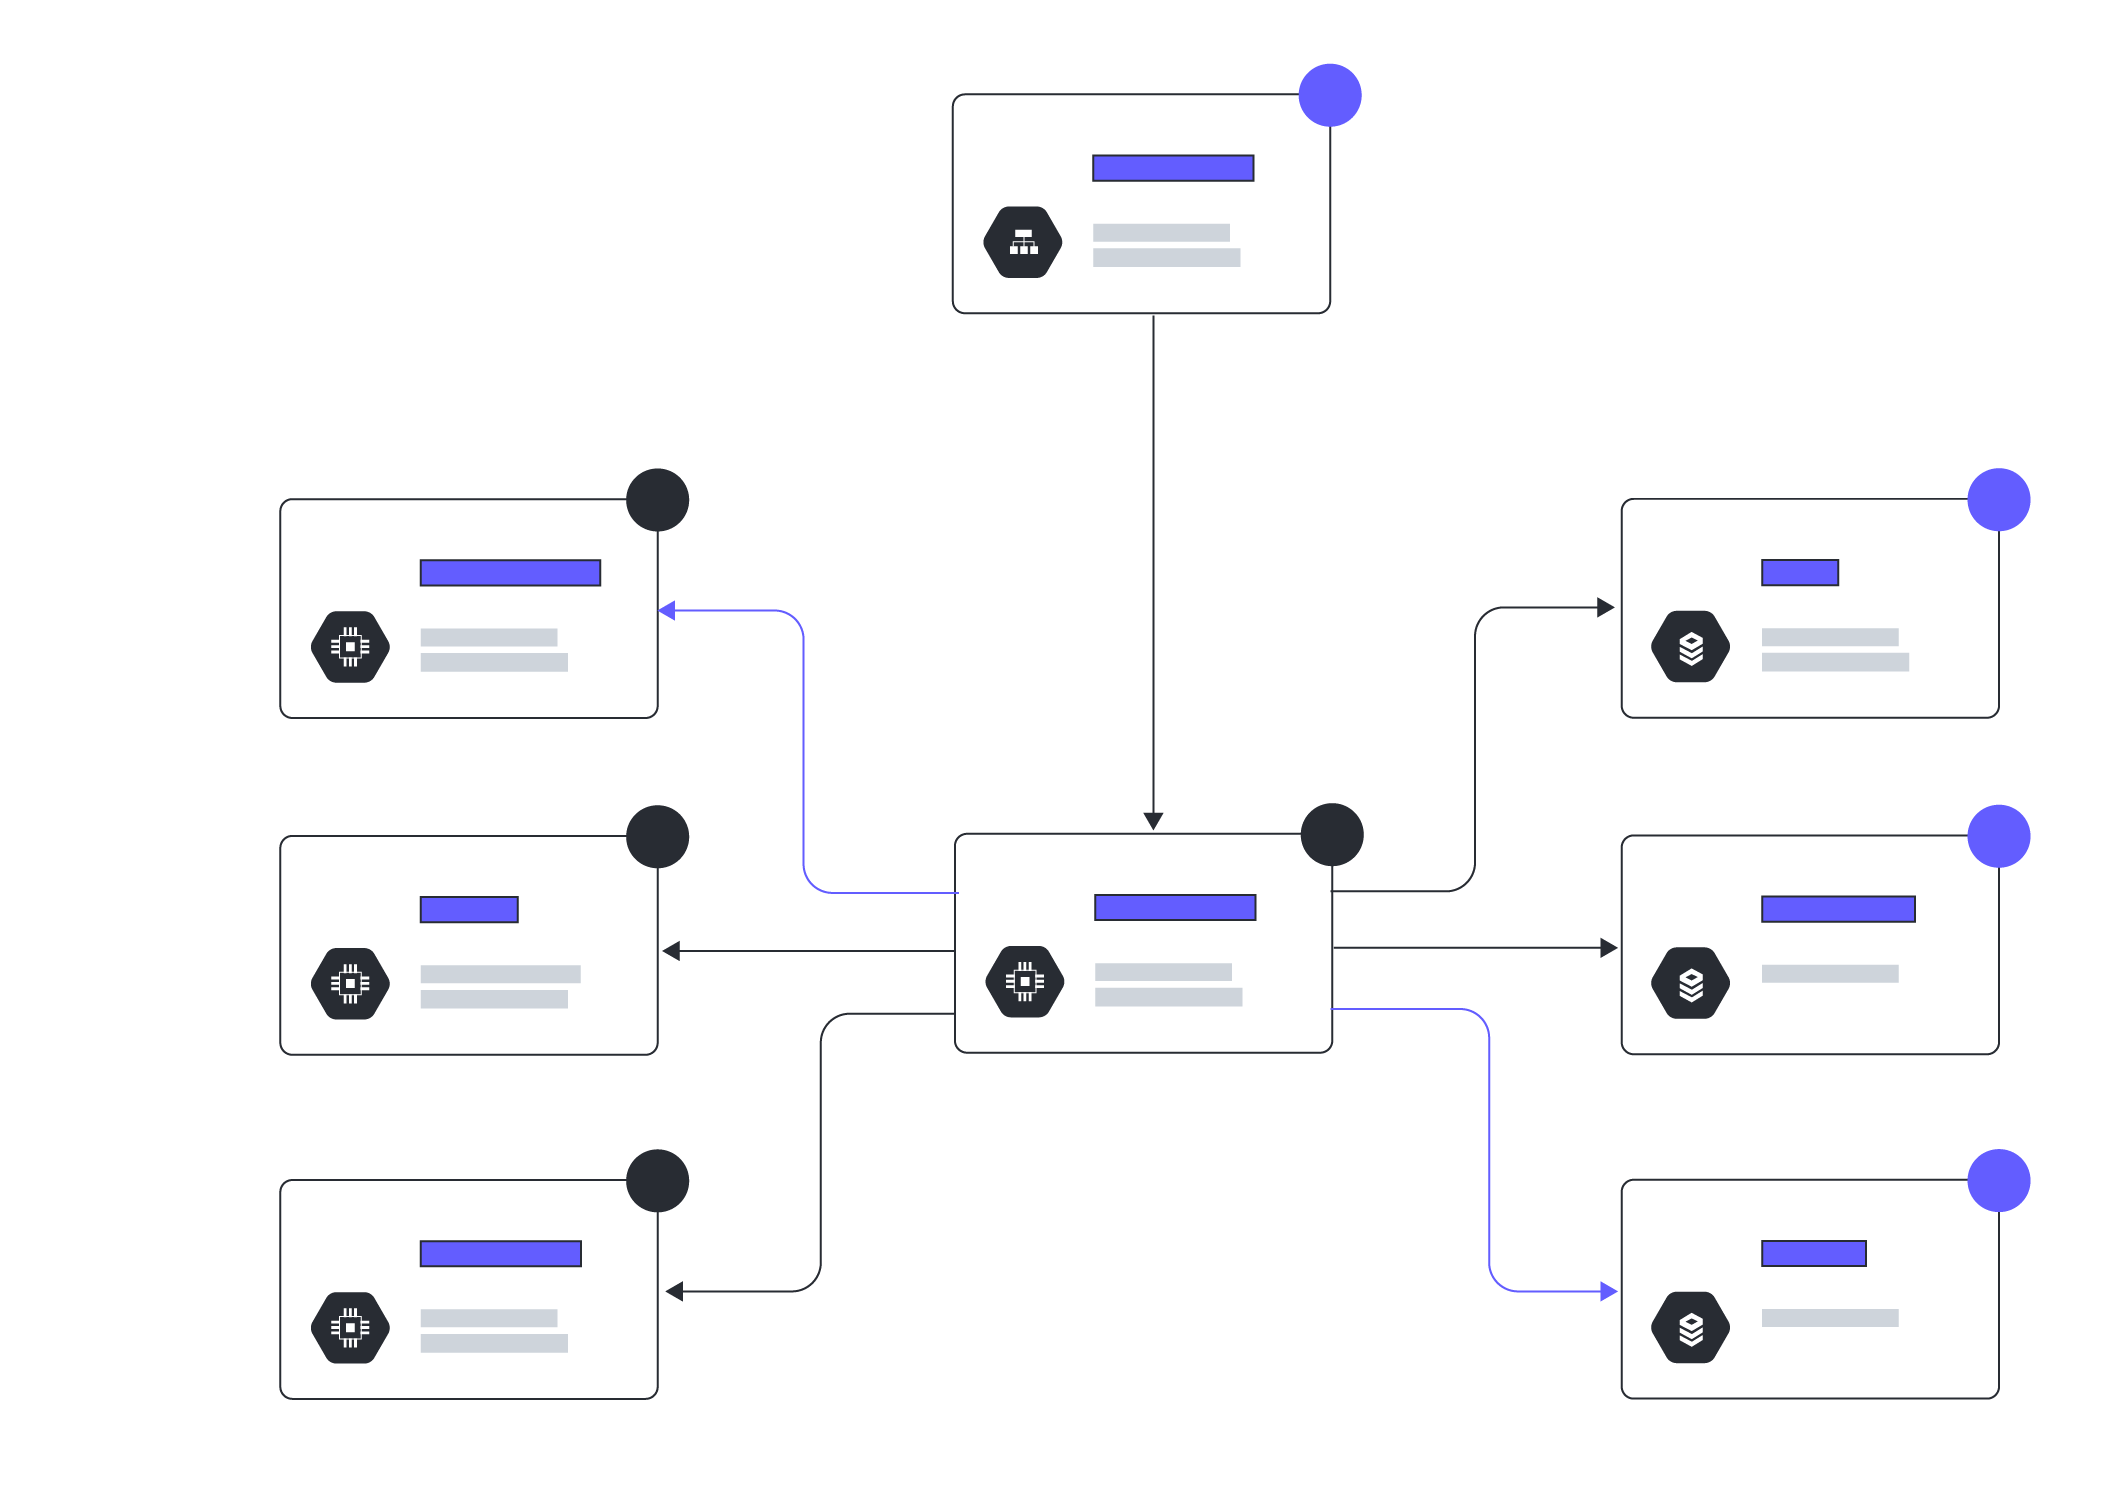
Google Cloud architecture diagram software
Lucidchart is a visual workspace that combines diagramming, data visualization, and collaboration to accelerate understanding and drive innovation.

A Google Cloud diagram software for flawless network optimization
Visualize your ever-changing cloud architecture with accurate documentation
Whether your organization has just migrated to the cloud or you have strict documentation requirements for your engineering and IT teams, Lucidchart and Lucidscale can help you visualize and support your Google Cloud architecture. Lucidchart helps businesses build and share accurate, future-state diagrams. Lucidscale auto-generates cloud models for existing architecture. Import Lucdiscale models into Lucidchart to plan updates to your network, all while communicating valuable details to stakeholders and leadership.
Create, maintain, and share accurate cloud architecture diagrams
Simplify your cloud architecture documentation with auto-generated Google Cloud diagrams from Lucidscale. Lucidscale is our cloud visualization solution that quickly generates and updates cloud models, which can be imported to Lucidchart to help you more easily troubleshoot network problems, onboard new employees, produce evidence for compliance, and speed up security reviews. Lucidchart allows users to add shapes, notes, and personal tags to communicate plans and ideas to key stakeholders and teams. To keep your diagrams updated, simply refresh your data, and our Google Cloud diagram software will reflect the changes in your visuals.
Verify the information that matters most
Our Google Cloud architecture diagram software helps you quickly visualize and communicate the most important cloud information. Lucidscale allows you to verify the current cloud structure, filter unnecessary information, or highlight the information you need most. Save your filtered views so as you refresh your data in the future, you can quickly jump back into a view without needing to reconfigure your filters again. Lucidscale shows teams important relationships and demonstrates what resources can send and accept traffic. Easily refresh data so your teams are always viewing the most up-to-date version of your Google Cloud diagrams and cloud environments. Verify that deployment was done correctly by comparing your Lucidscale cloud models to your development plans in Lucidchart.
Use key cloud governance data to plan your future
Our Google Cloud software lets you communicate your current or proposed future-state cloud architecture clearly to any audience, without the hassle of spreadsheets and complicated data sets. Whether you’re using Lucidchart to communicate designs and potential changes with engineers and cloud architects or sharing the current state of your network modeled in Lucidscale, you can make sure that you’re providing the right level of detail to each audience. Lucidchart’s customizable diagrams allow you to maintain a consistent look and feel across all of your Google Cloud architecture diagrams, making your information easier to read, share, and understand as you iterate and improve your cloud architecture.
FAQs about Google Cloud architecture diagram software
Lucidchartで楽々プロジェクト管理

Used by millions across the globe
"Lucidchart charting was the missing SaaS tool needed to complete any IT professional’s SaaS toolset."

4.5/5 stars 650+ reviews