Genogram online
Lucidchart is a visual workspace that combines diagramming, data visualization, and collaboration to accelerate understanding and drive innovation.

Creating a genogram with the online Lucidchart genogram software
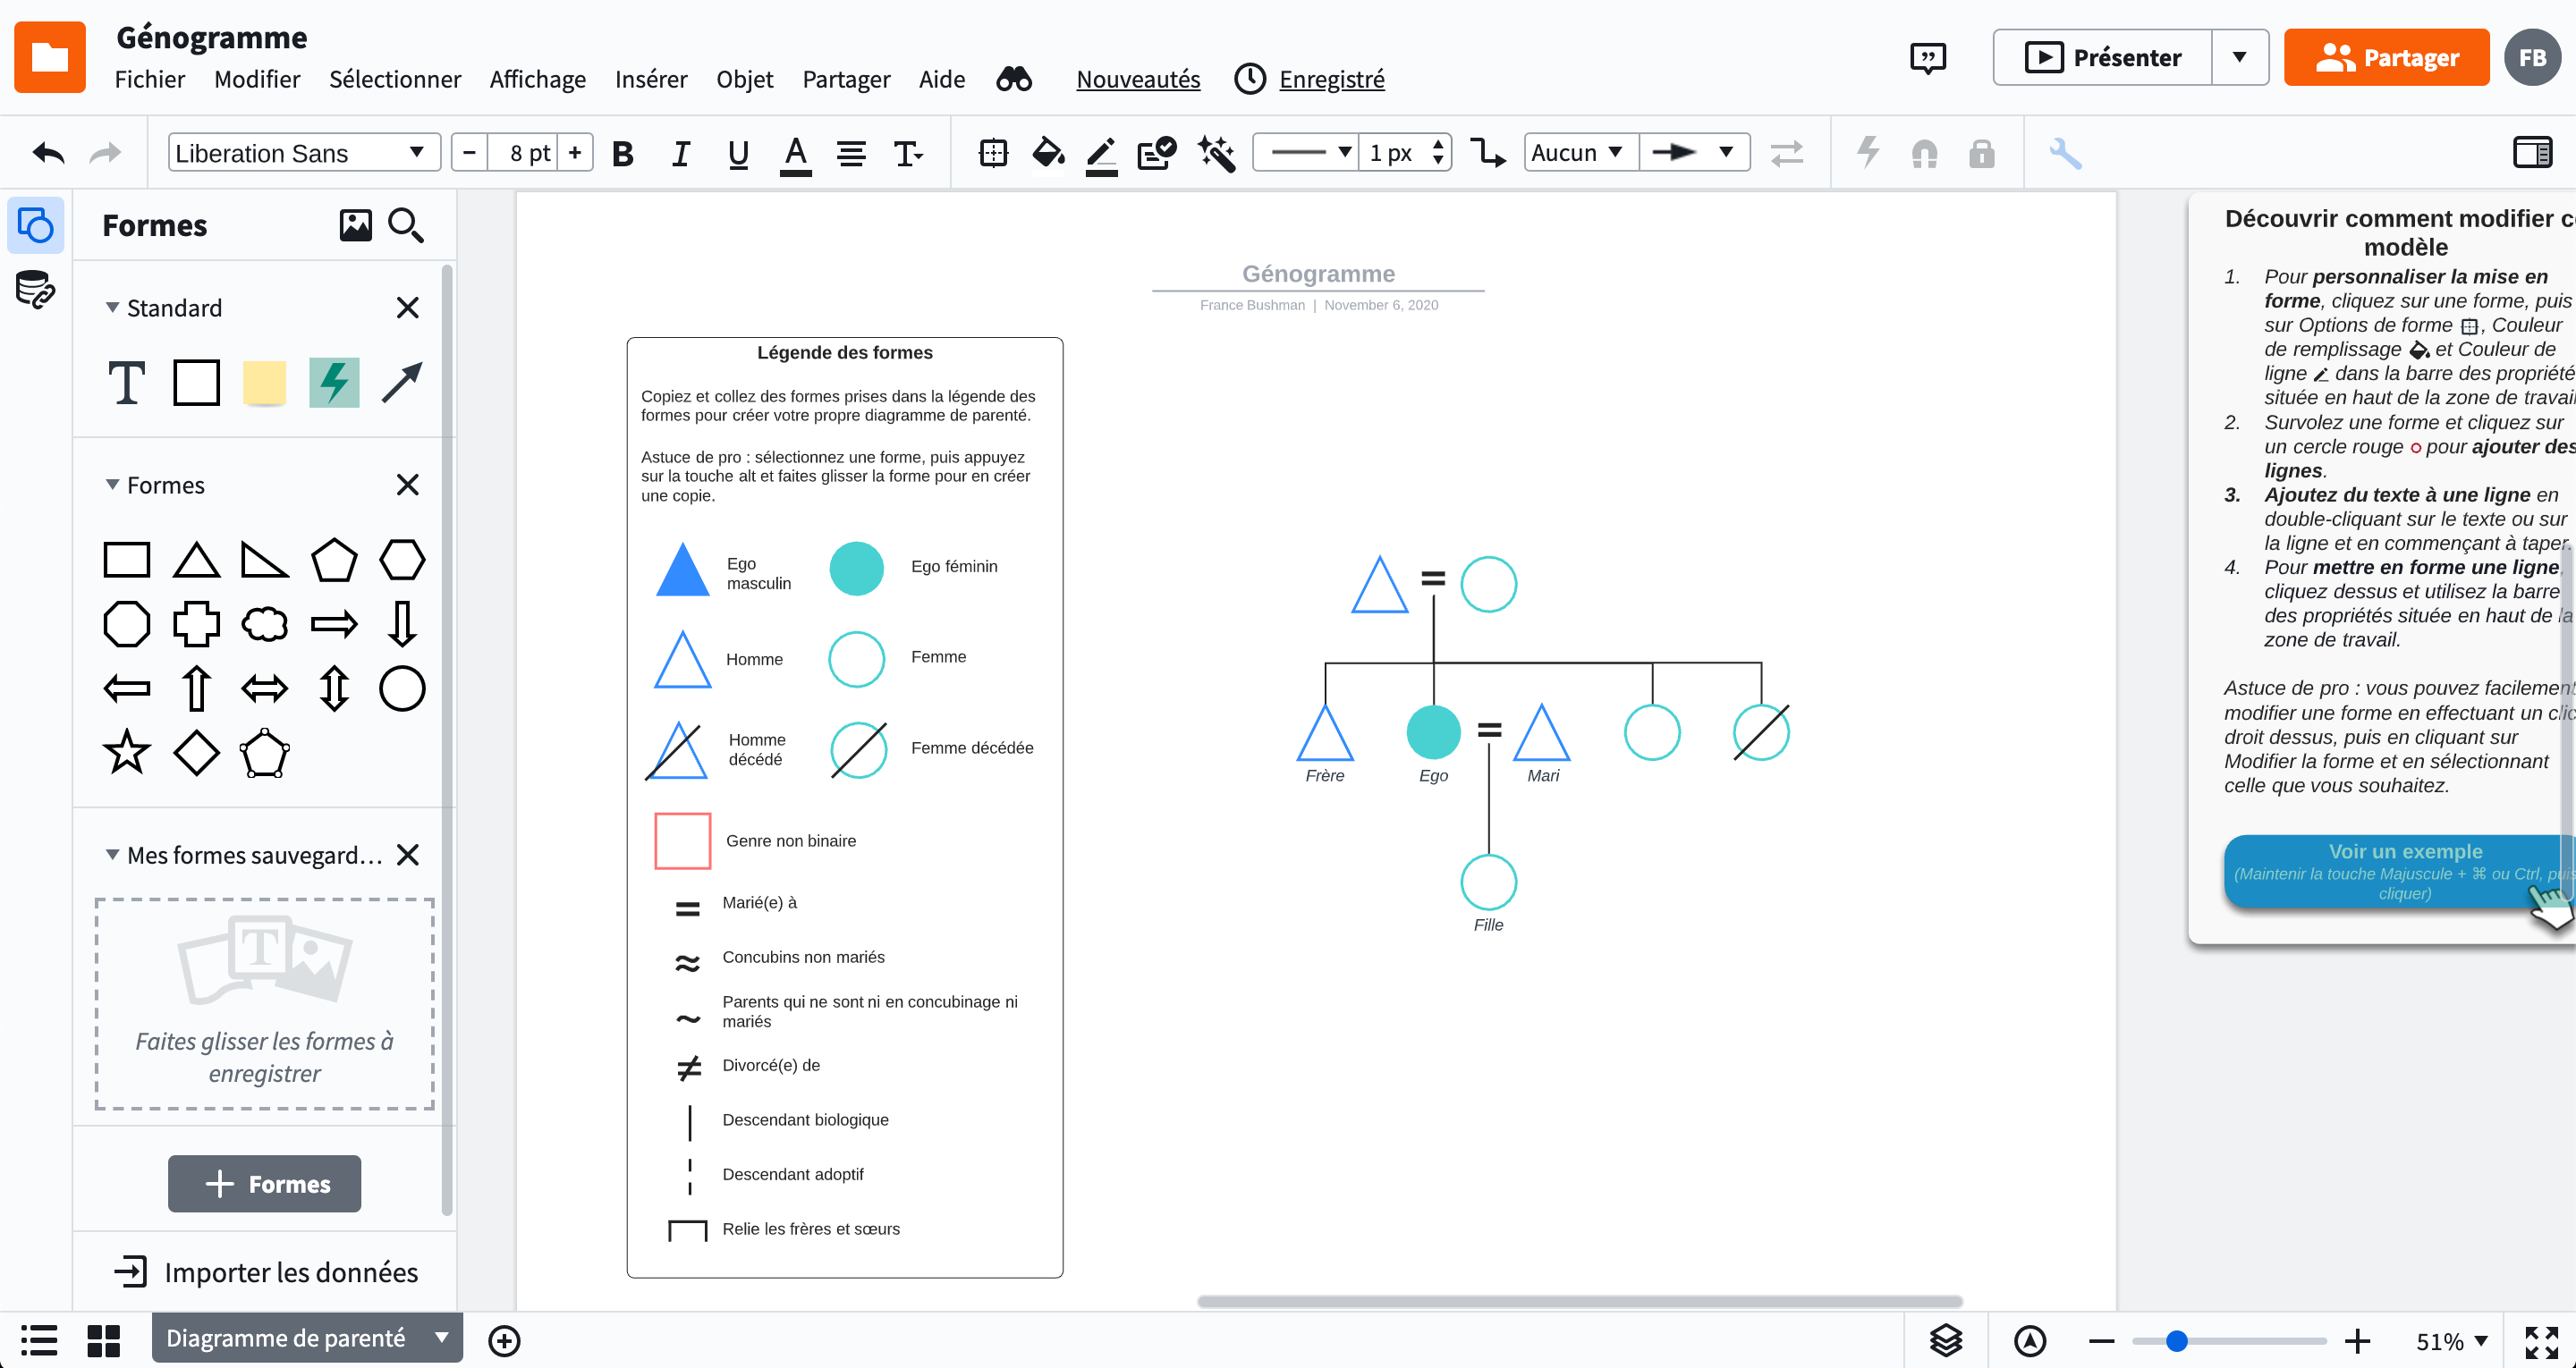
Easily visualise a person’s family relationships and history
Lucidchart helps you create genograms online to visualise a person’s family relationships and history. The genogram is an image that goes beyond a traditional family tree, allowing creators to visualise the patterns and psychological factors that affect relationships. Today, genograms are used by various groups of people in many fields, including medicine, psychology, genetic research, education, and social services, etc.
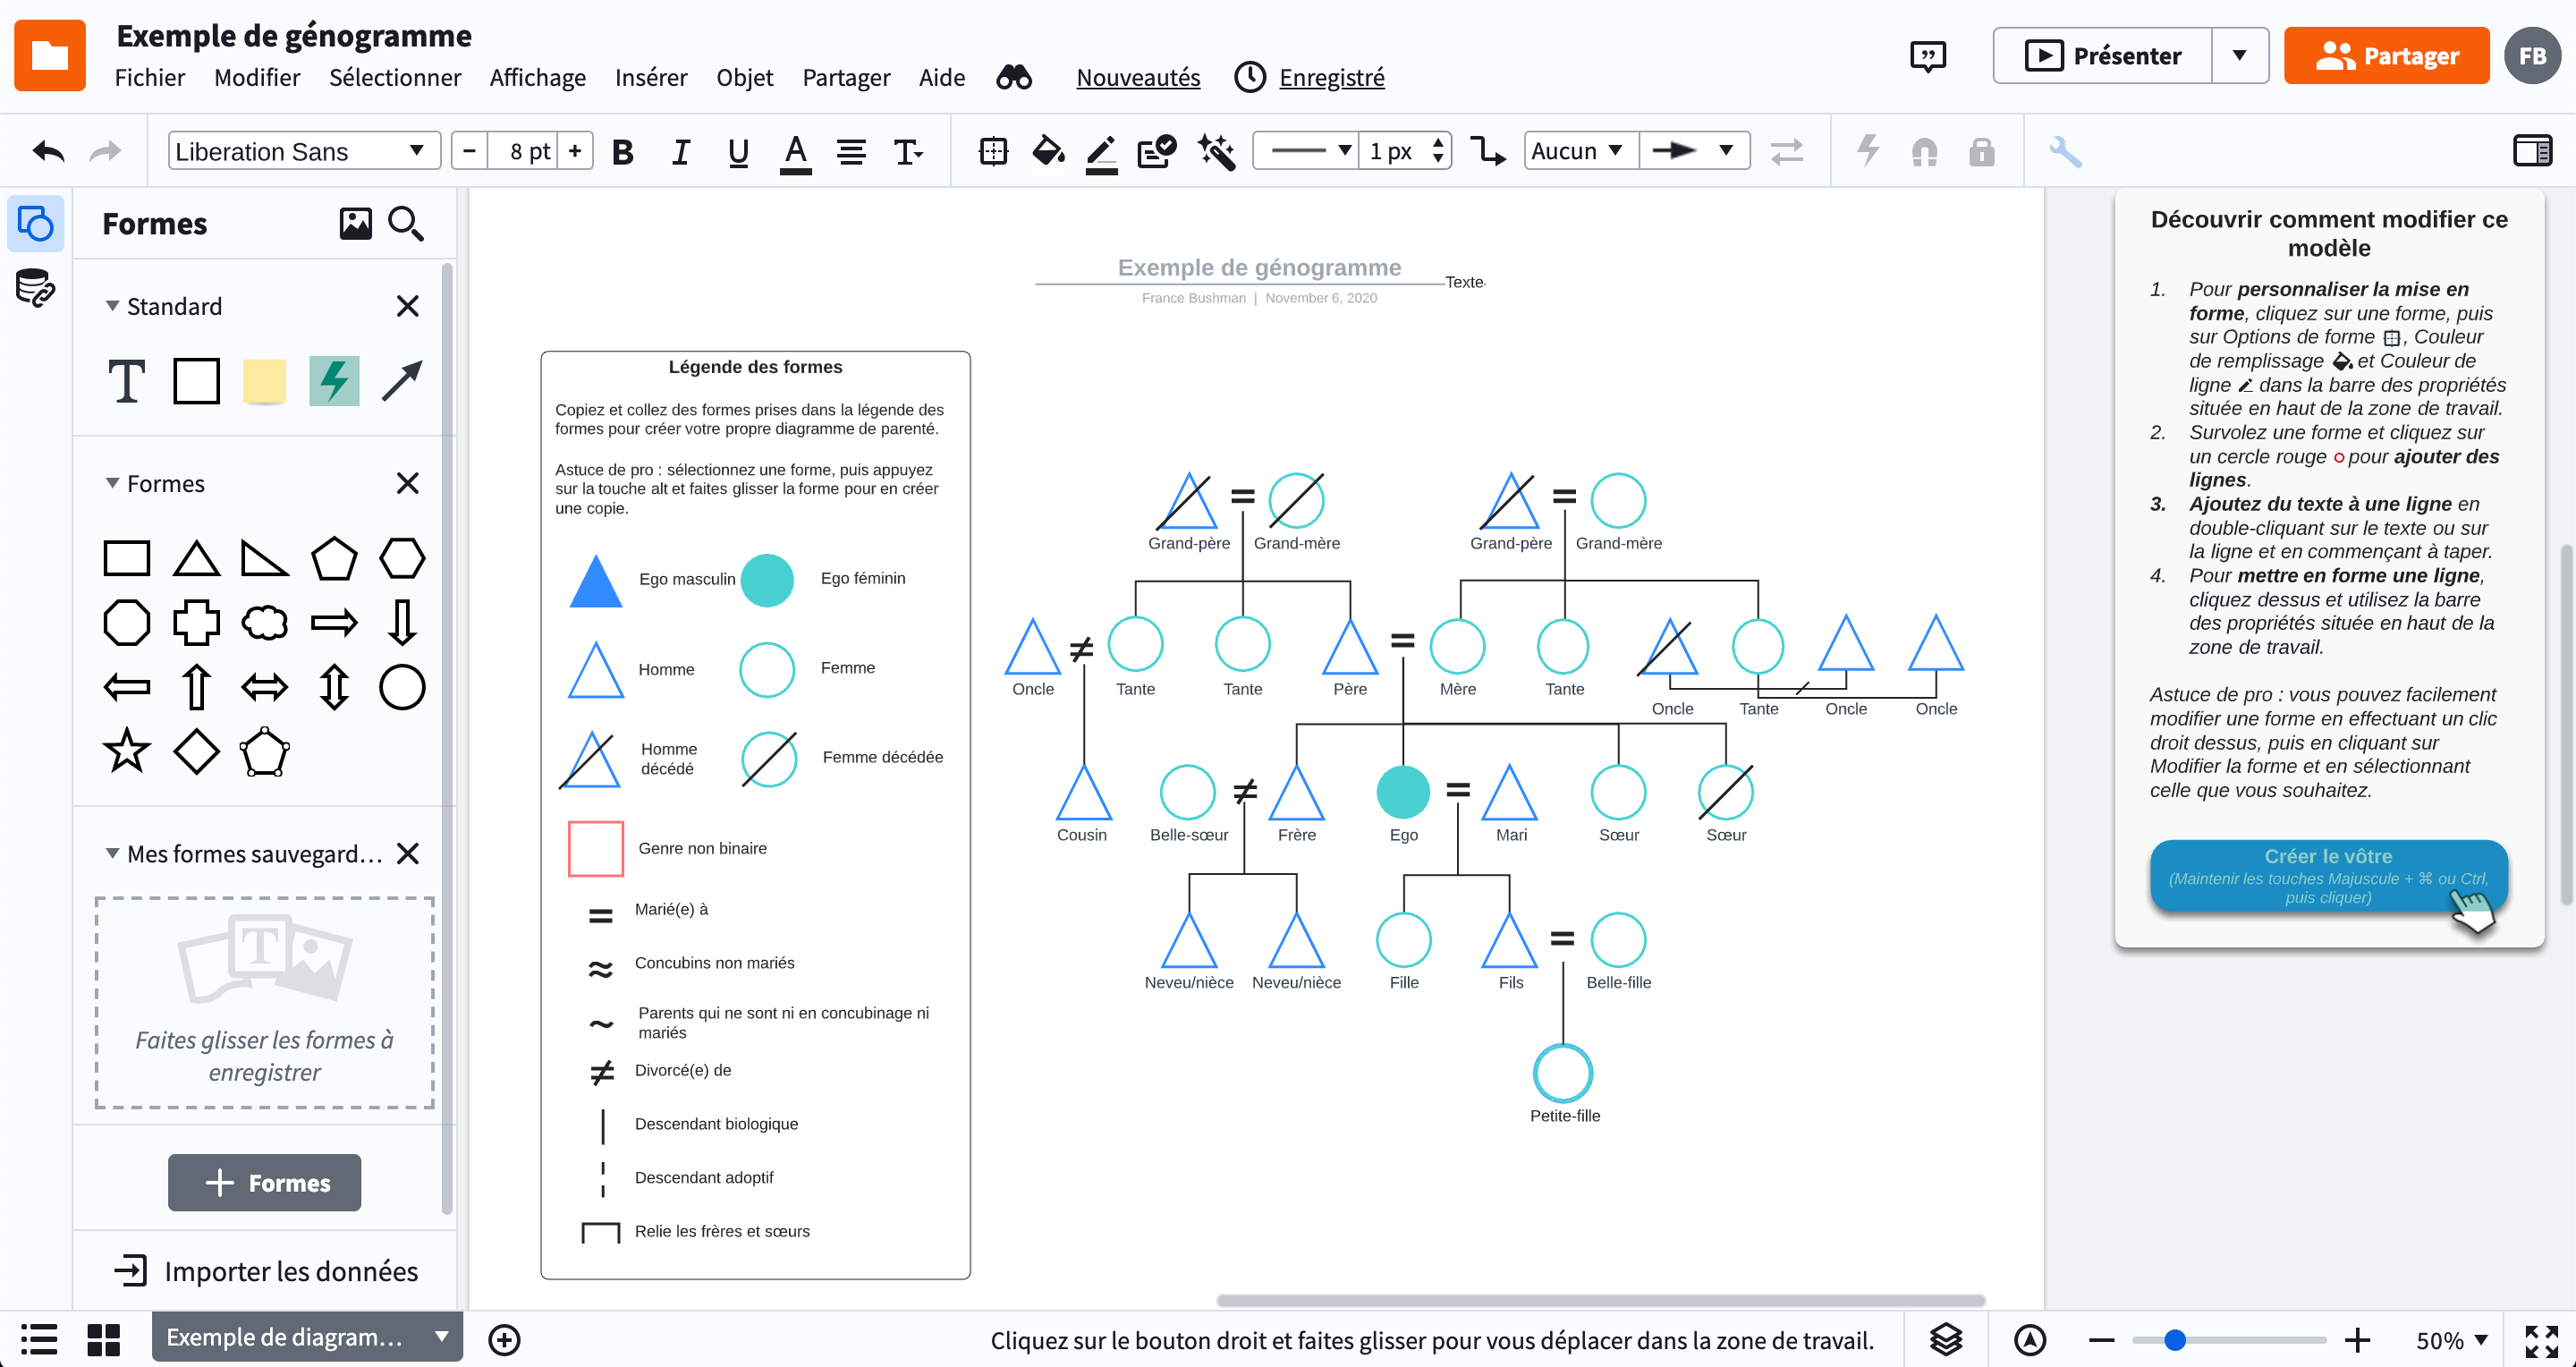
Create a genogram online simply and quickly
Lucidchart makes it easier to create genograms that let you illustrate a person’s family members, their family relationship and their medical history. Make your job easier by choosing a template from our template library or take advantage of our interface using drag-drop and our styling tools to customise your diagram. In addition, with our cross-platform genogram creation software, you can create your genograms on your computer as well as on your smartphone or tablet.
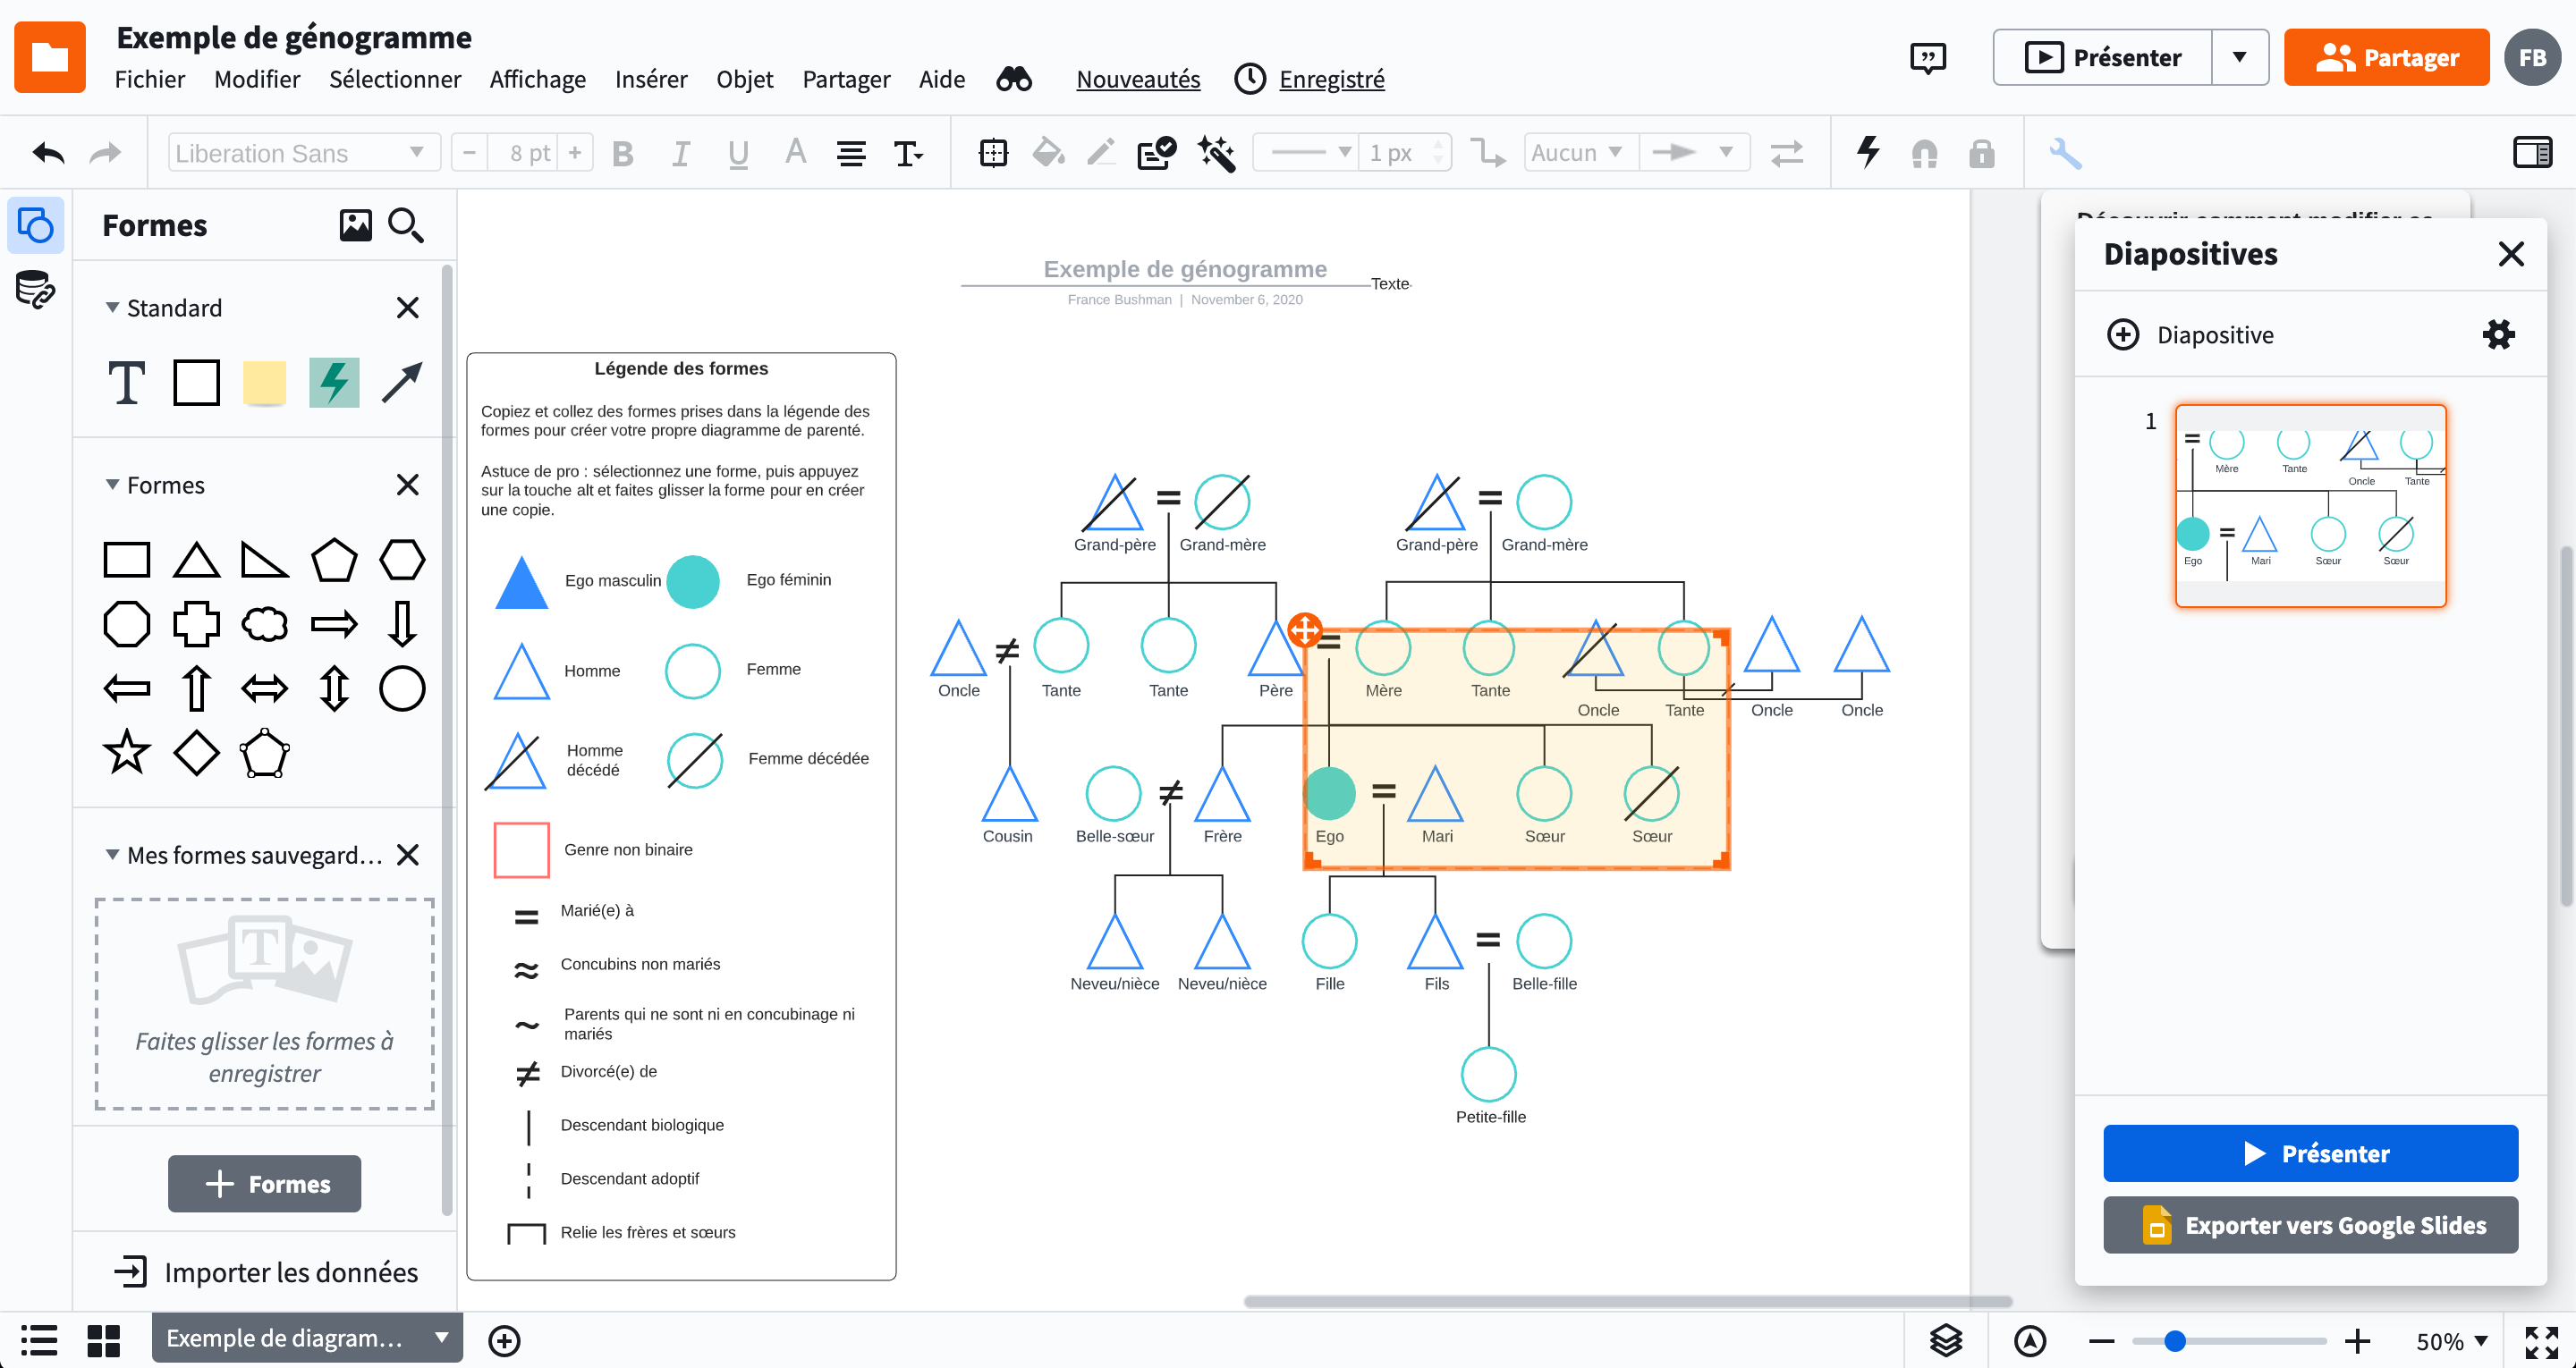
Presenting a genogram online has never been easier
Easily present your genogram online using the integrated Lucidchart presentation mode or by exporting it to your favourite applications (Excel or PowerPoint, etc.). In this way, you can simply display your diagram on your computer, tablet or smartphone. Lucidchart also lets you create slides focused on certain family members or on particular background information to highlight different episodes in a person’s life.
How to create a genogram online with Lucidchart
Determining your goal
Why do you want to create a genogram? What will it be used for? Knowing the purpose of your genogram will make it easier for you to determine the type of information you need to look for.
Gathering information
Compile and organise the results of your research on a person’s family members, their family relationship and their history over two or three generations to incorporate them into your genogram online.
Starting from scratch or selecting a blank template genogram
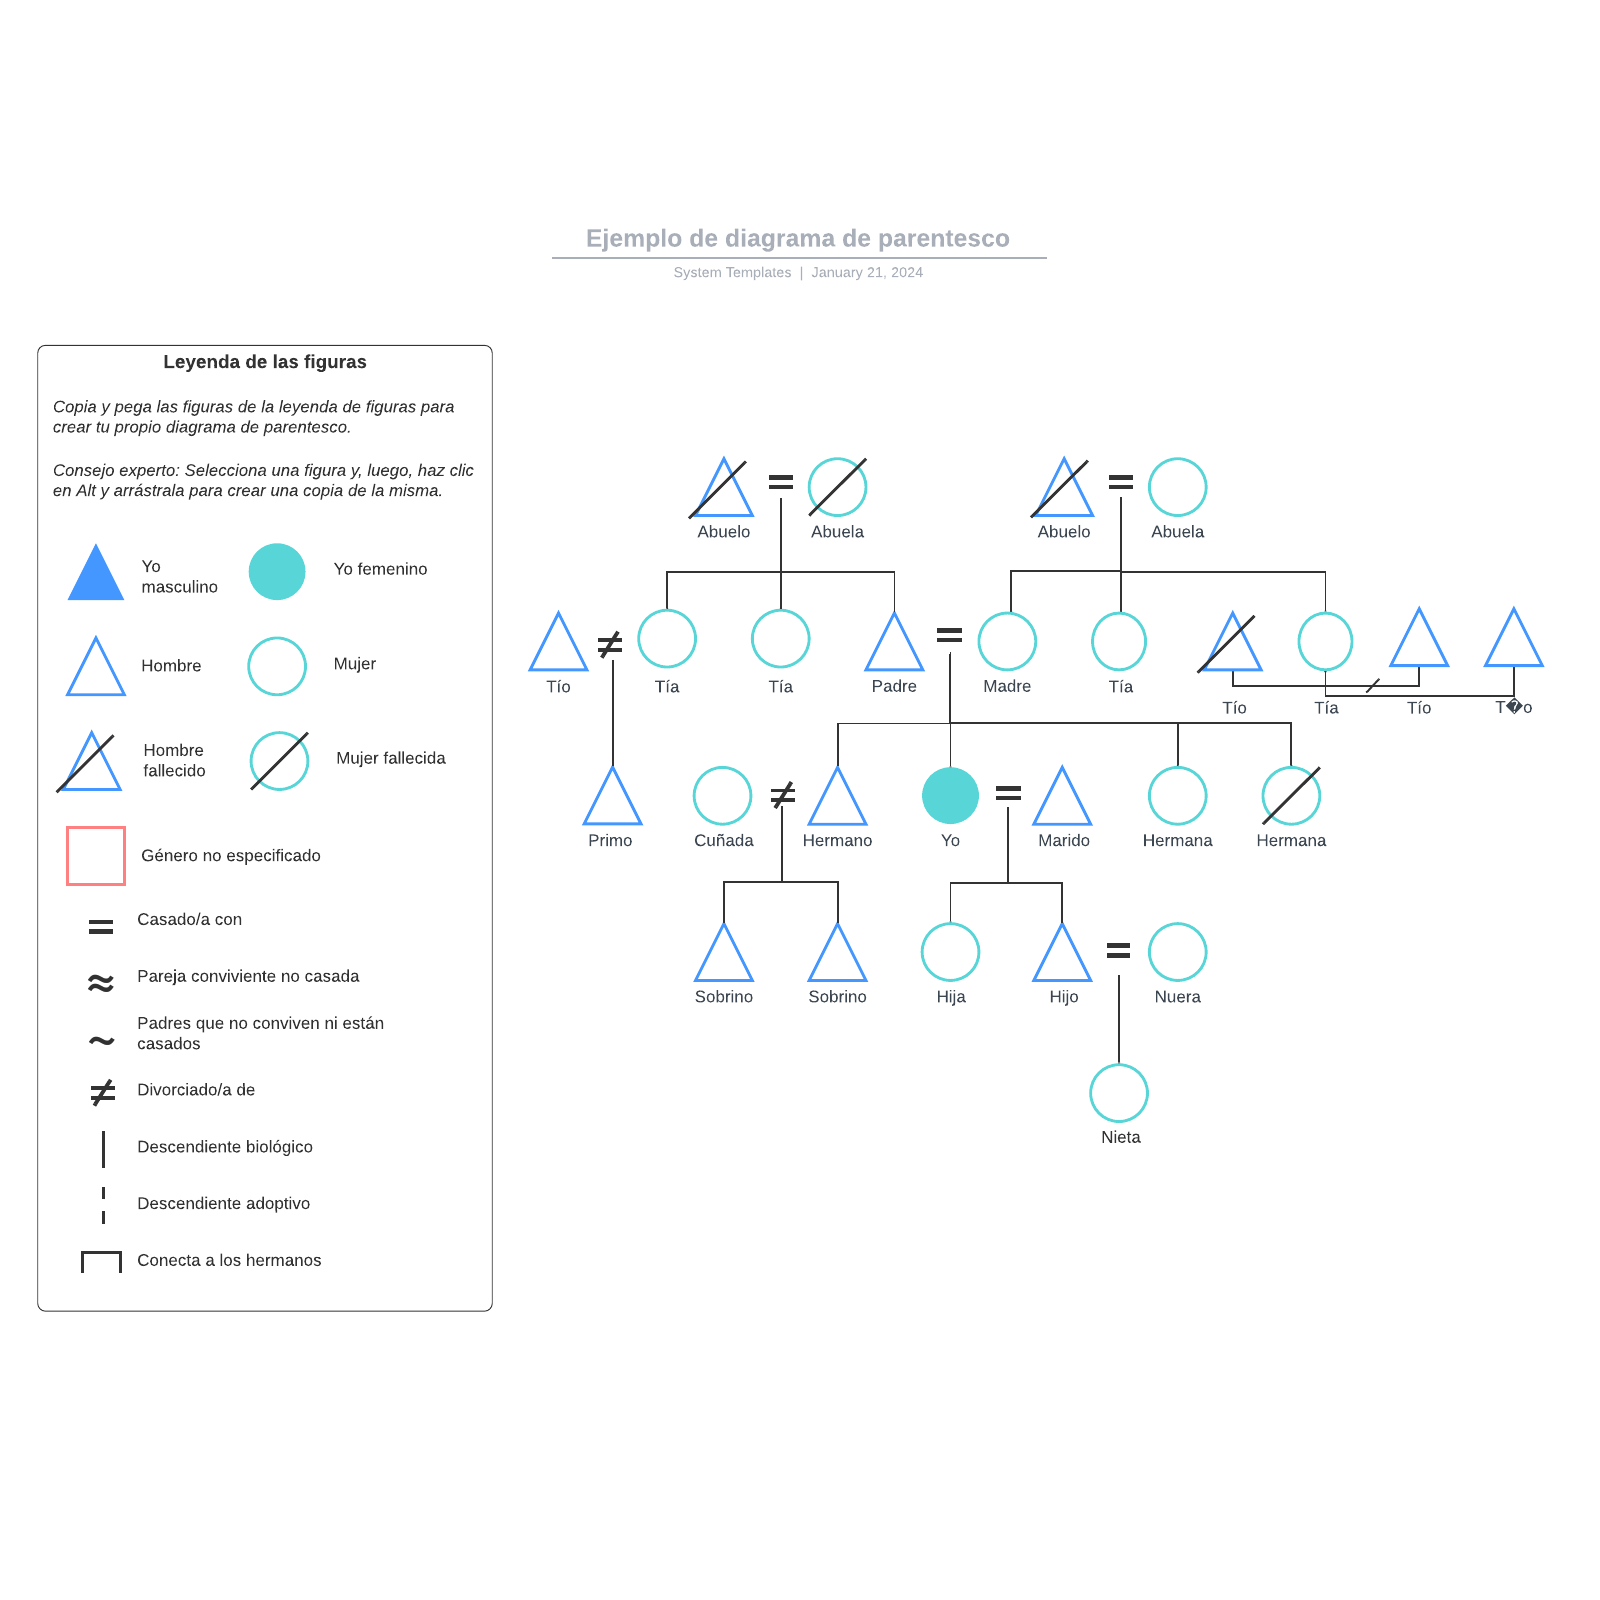
Customise a template or create your own genogram online by dragging shapes over the work area. The oldest generation is shown at the top of the diagram and the youngest at the bottom. The father is always drawn on the left, while the mother is on the right. The children also follow a pattern, with the eldest being placed in the left-most part and the youngest on the right (in descending order of birth).
Using the right symbols
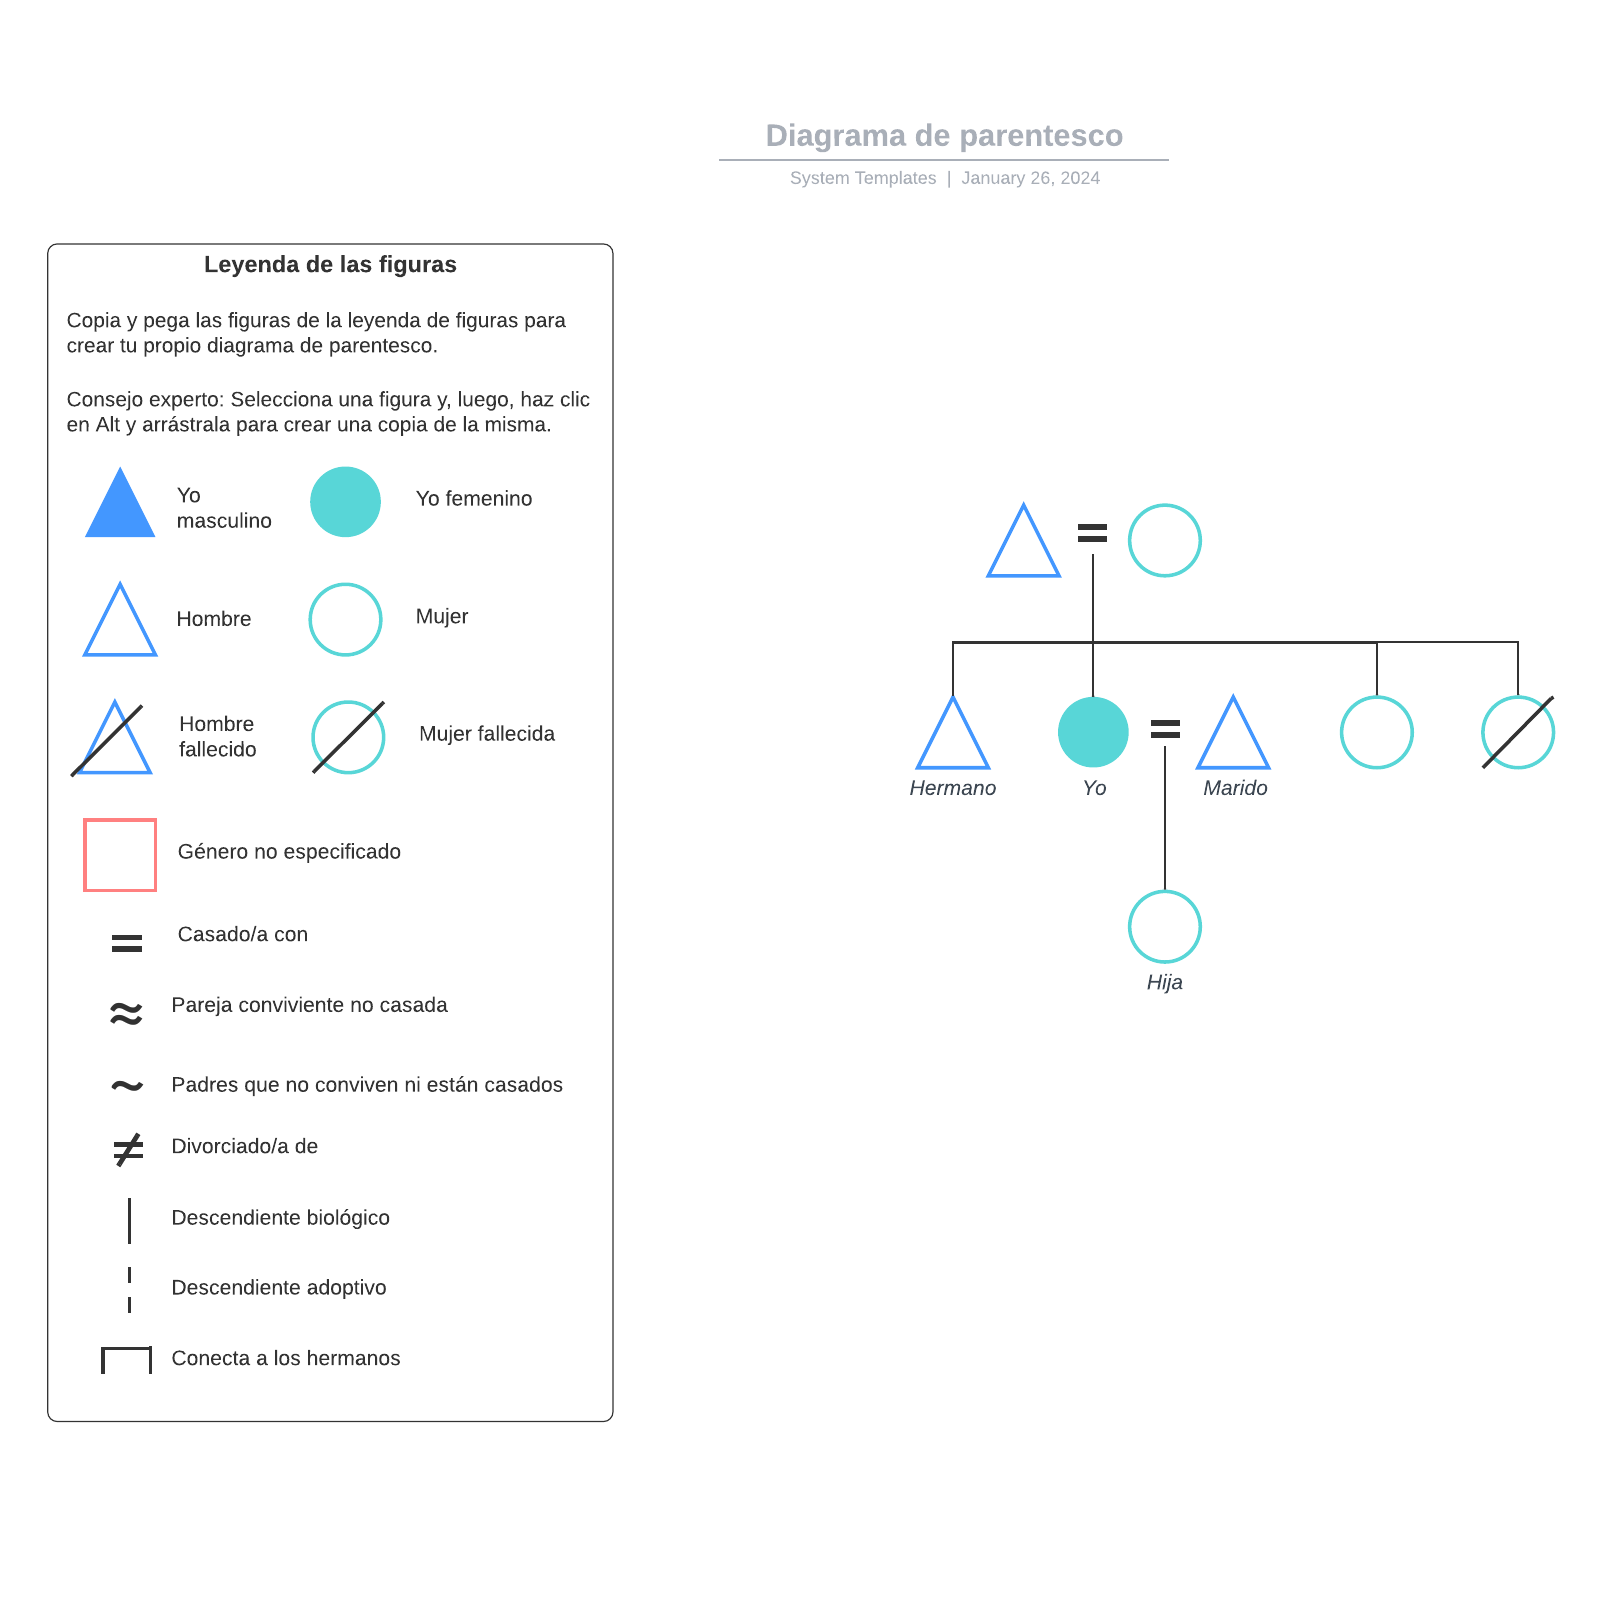
Genograms use a variety of symbols to represent family members and their relationships with each other. For instance, men and women are portrayed differently, and relationship symbols all have distinct characteristics that make them easily recognisable to professionals.
Sharing your genogram online
Fill in the gaps in your genogram online and make sure it’s accurate before presenting and sharing your work via email or a publication link, or by exporting it to your favourite applications.
Get off to a good start with our online diagram tool
Used by millions across the globe
“Lucidchart is particularly useful for project management, website design, presentations and signage. I’ve also used it to make family trees online. It complements other graphic design tools when I need more intelligent flowchart symbols.”

4.5/5 stars 650+ reviews
