
A Business Process Model and Notation diagram, also known as a BPMN diagram, is a useful tool that displays an internal business process. The goal of a BPMN diagramis to present a visual representation of a particular business procedure so that it’s understandable by all stakeholders. In this manner, different business units can see the collaboration and transactions that occur within an organization.
BPMN was developed by the Business Process Management Initiative (BPMI) and is maintained by the Object Management Group (OMG). In 2005, the two units merged and have released updates to the BPMN standard. The latest iteration, commonly referred to as BPMN 2.0, came out in 2011 with the aim of having a single spec for creating a Business Process Model and Notation diagram. The new version added more levels of detail such as interrupting and non-interrupting event and a more detailed sub-processes.
7 minute read
Would you like to create a BPMN diagram? Test Lucidchart - fast, easy, free.
Graphical elements found in a BPMN
A BPMN diagram is typically drawn left to right, though you could create a vertical version. A BPMN diagram consists of core elements categorized into four groups: Flow objects, connecting objects, swimlanes (or pool), and artifacts. Each group has symbols that represent different actions within that group. We’ve described these terms below and shown how each appears within a BPMN diagram.
Flow Objects:
These are elements that are connected and form a process flow.Events:
Depicted as circles, they represent something that happens. Inside the circle, there are often icons that denote the type of event. For example, if there’s an image of an envelope in the circle it means it’s a type of message. Additionally, circles that have solid boundaries are considered interrupting, while those with a dotted line are non-interrupting. If there is a double line around the circle, it’s an intermediate event, and if the line is bold, it’s the end of an event.

Activities
: These are business processes that are performed, such as “generate a report.” Activities appear on a BPMN diagram as a rounded corner rectangle. Within activities there can also be tasks and a variety of sub-processes.
Gateways:
If an activity needs to go through different business process flows, you need to draw a diamond shaped gateway. Connect the activity to the diamond and then it breaks off pointing to two different activities in the process flow.
Connecting Objects:
These symbolize how objects are connected to each other and represent things that flow through a process.Sequence Flow:
These are a solid line and arrowhead that depicts the order in which activities are performed.
Message Flow:
Displayed as a dashed line with an open circle at the start of the line and open arrowhead where the line terminates. These represent which messages flow across organizational boundaries.
Association:
A dotted line that shows relationships between, text and artifacts, data, and flow objects.
Swimlanes/Pool:
These organize different aspects of a business process on a cross functional flowchart. They appear as wide rectangles.
Artifacts:
These categorize activities and can be used to include more information about a process in the BPMN diagram.Data Object:
The data required for a process. It looks like a piece of paper with the top right corner folded down.Group:
Consisting of a rounded corner rectangle with dashed lines, it groups different activities.Text Annotation:
Text that provides more information.

Would you like to create a BPMN diagram? Test Lucidchart - fast, easy, free.
Creating a BPMN ModelHow to make a BPMN diagram online using Lucidchart
Now that you have an understanding of the elements that make up a BPMN diagram let’s see how to create one using Lucidchart. We’ve already created templates and BPMN icons to help you get started with the process, feel free to modify them to fit the needs of your diagram. Log in to your account (if you don’t have one, sign up to try Lucidchart for free) and follow the steps below.
1.
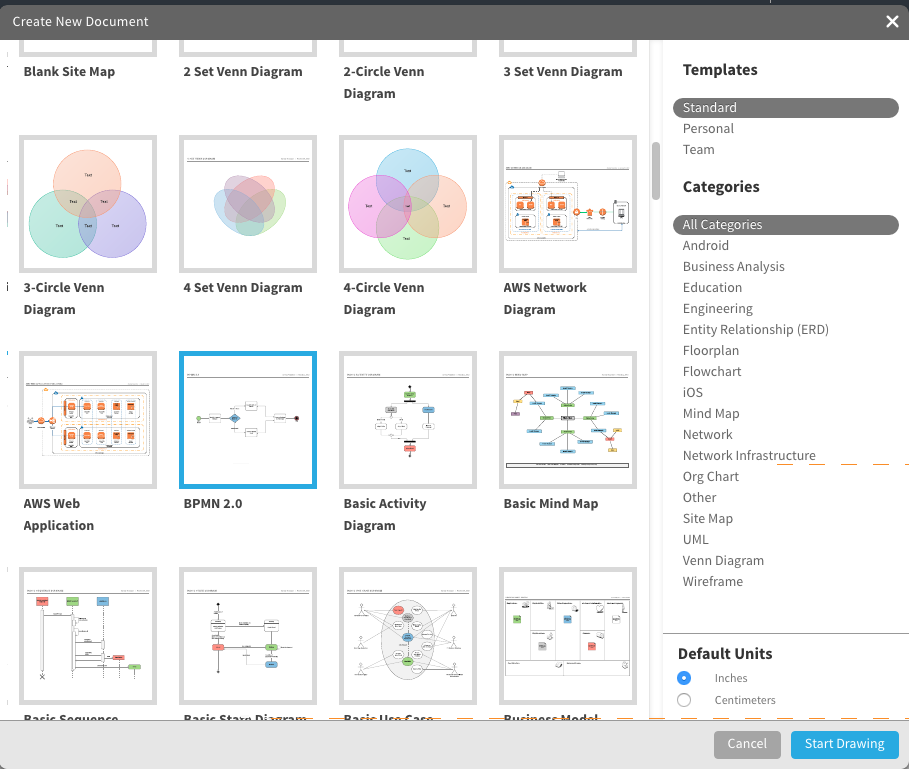
Select a BPMN diagram template
In the Documents section, click on the down arrow in the orange +Document button and double-click on the Blank BPMN 2.0 template.
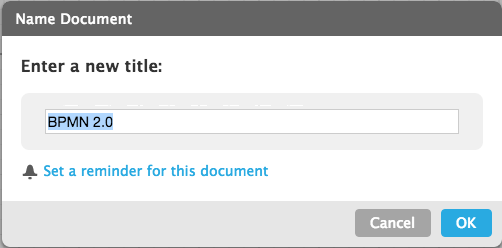
2. Name the BPMN Diagram
Click on the BPMN 2.0 header in the top left corner of the screen. Once the pop-up screen opens, type the name of your diagram in the text box and click OK. The name of your BPMN diagram appears in the top left corner of the screen.
3. Start BPMN process
Our template depicts a payment process. We’re going to modify it to show the BPMN diagram for an incoming invoice. To start the process, you’ll need to create an open circle. Click on the green circle so it’s selected and change the color by clicking the color-fill option in the menu bar and select white.
Tip:
When you click on the circle, you can change it to a non-interrupting event by clicking the Non-Interrupting box in the pop-up window. You can also specify the event type.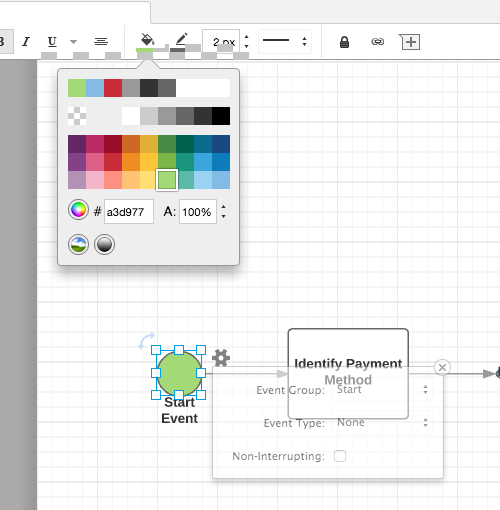
Rename the event by double clicking on Start Event, press the Delete key on your keyboard, and type the new name.
4. Add activities
There are some activities already on the template, but you can customize them. If the activities are where you want just double-click on the text to change it.
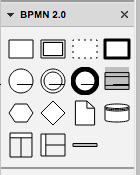
Add more activities by dragging and dropping BPMN icons onto the diagram. In the left column of the screen, you’ll notice a lot of shapes and symbols. We’ve already created the symbols needed to make a BPMN diagram. Scroll to the bottom of the list to the BPMN 2.0 section. These are all the BMPN symbols you need. (Note: hover over each to see what they represent: task, transaction, process, data object, gateway, swimlane/pool).
Tip:
As you place elements on the graph you can customize it even further by selecting what the activity (or task, gateway, etc.) does by choosing an option provided in the pop-up window. You can access this window anytime by clicking on the element and clicking the gear icon in the top right corner.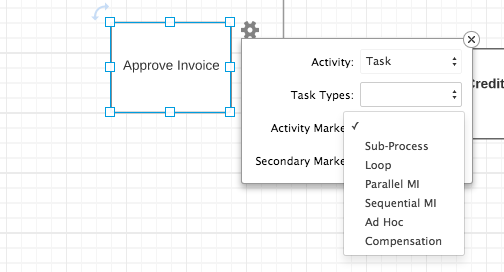
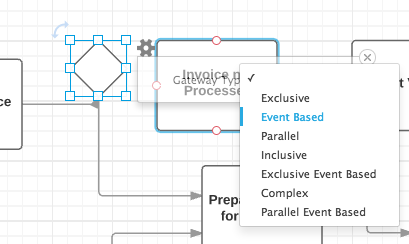
5. Add gateways
There is already a gateway on the template, but if you need to add more select the gateway icon from the set of BPMN 2.0 tools and drag it to where you want it placed on the diagram. Choose the type of event from the drop-down window in the pop-up box. The corresponding icon will appear in the gateway triangle.
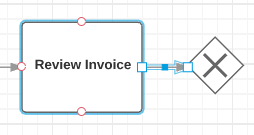
6. Add connecting objects
Double-click on an activity or gateway, and click and hold one of the orange circles and drag the line to the appropriate symbol. An arrow is automatically drawn between the two objects.
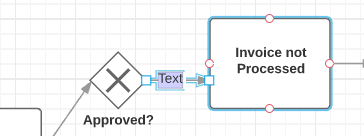
Name the actions of the connecting objects by either clicking directly on the arrow until a text box appears or clicking on the T in the standard box (located at the top of the icon options on the left side of the screen). If opting for the latter option, place your mouse on the graph where you’d like the text to appear, click and a text box appears. Type the text you want.
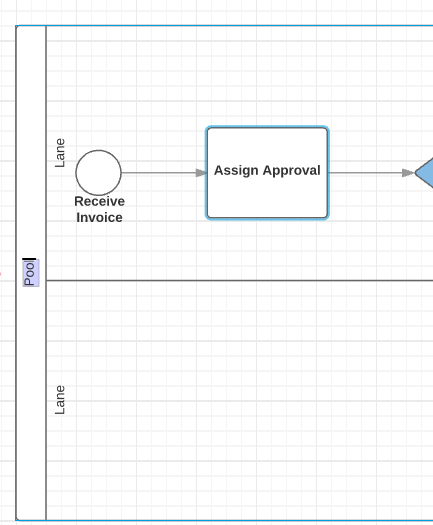
7. Add pool or swimlane
Perhaps one group in your organization completes certain actions on the BPMN diagram, and another department accomplishes other activities. Make this evident on the diagram by adding a pool/swimlane.
Select the pool icon from the set of BPMN 2.0 tools and drag it to where you want it placed on the diagram. Select the type of event from the drop-down window in the pop-up box. The corresponding icon will appear in the gateway triangle. Double-click on the text Pool and Lane to change the content.
Tip:
You can adjust the amount of swimlanes that appear as well as orientation by clicking the gear icon in the top right corner of the pool.You’ll likely need to realign the events so that they fall in the appropriate swimlane. To move multiple items, click the first item, hold the shift key and click any additional items you want to move and drag them to the appropriate lane. The connecting objects will realign themselves automatically.
8. Customize the BPMN diagram with colors and fonts
Once you have the basic design of your diagram, you can add colors to symbols, and change fonts. Here’s how to:
Add colors to elements:
Click on an element on the diagram and then click the color-fill icon on the menu bar and choose a color.Tip:
To make multiple elements the same color, click the first item and then hold the shift key and click the remaining shapes. Next, click the color-fill icon and choose a color.
Change the font:
Choose Select All from the Edit option in the menu. Click the font box, choose a new font, and click it. All text in the diagram will be updated. You can use the other shortcuts (font color, size, bold, italic, underline, and alignment) to customize the font even more.
9. Share your BPMN
diagram
The title you created at the beginning of this exercise will appear at the top of the diagram. Once you like the way the BPMN diagram looks, you can share it with others either via email, link, social media (Facebook, Twitter, Google+, and LinkedIn), or embed it on a website. Click the blue Share button in the top right corner of the screen and a pop-up will appear. Choose how you’d like to share the diagram and enter the appropriate information.
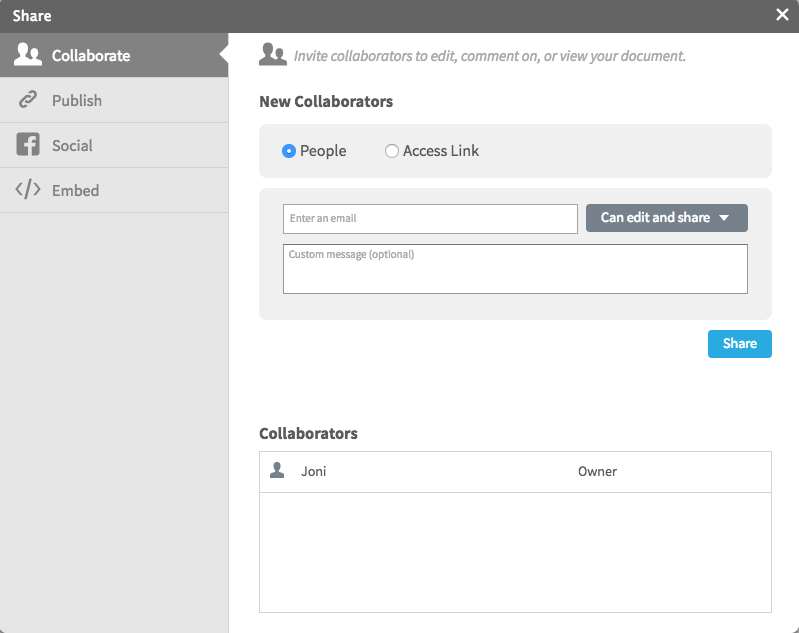
When you add a collaborator by sending a link to the BPMN diagram via email, you can work on the diagram simultaneously and use the chat feature (the yellow quote icon in the top right corner of the screen) to have discussions.
The fastest way to make a BPMN online
There you have it, in just nine easy steps you can make a BPMN diagram or BPMN 2.0 diagram online. Since Lucidchart is a web-based app, your diagram is automatically saved, and you can access it virtually anywhere you have an Internet connection. Sharing the BPMN diagram with colleagues couldn’t be easier, and you’ll never have to wonder if they can open the file or access it. Sign up for a free trial, and see how easy it is to use Lucidchart.