Tips to make a SWOT analysis in PowerPoint
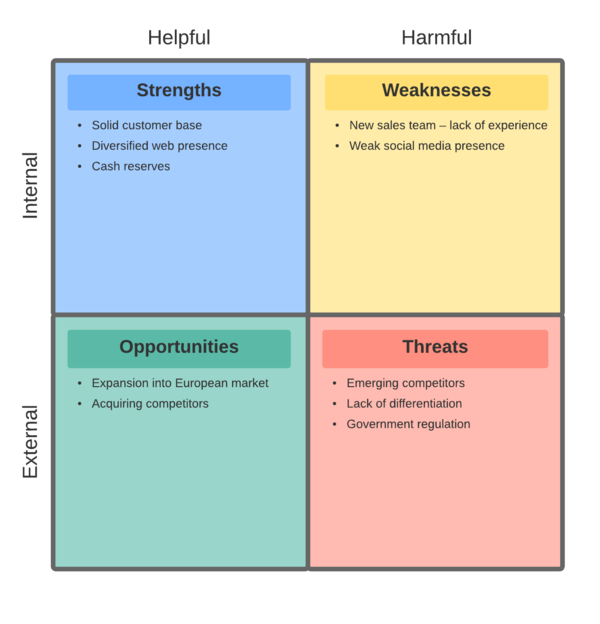
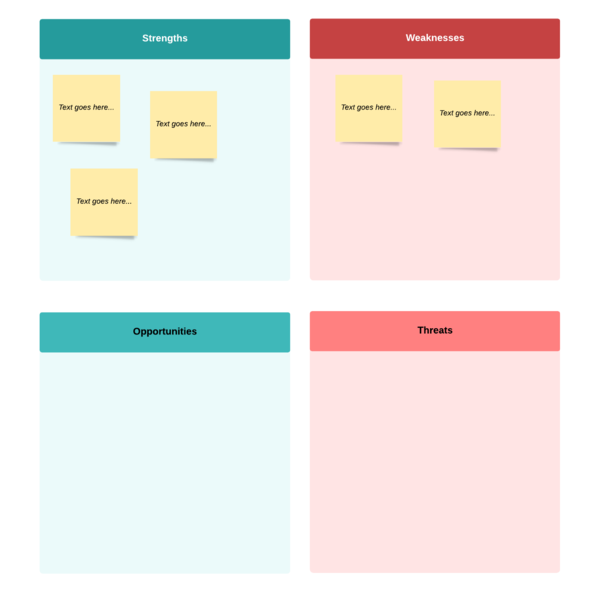
SWOT diagrams are brainstorming tools designed to help with planning and long-term outlooks. SWOT stands for strengths, weaknesses, opportunities, and threats—positive and negative aspects of a business plan, divided into the internal and the external.
PowerPoint is another tool favored by large businesses as the go-to solution for slideshows and presentations. While exquisite visual slideshares are a big advantage to using PowerPoint for presenting your SWOT analysis diagrams, one of the bigger drawbacks is that this program was not designed primarily for diagramming—you will need to re-engineer your canvas to create a professional-looking diagram.
This guide will walk you through the two ways to use PowerPoint to create a SWOT analysis diagram with the help of Lucidchart.
Getting Started in Lucidchart in Under 5 Minutes
- Create your first SWOT analysis from a template or blank canvas or import a document.
- Add text, shapes, and lines to customize your diagram.
- Learn how to adjust styling and formatting within your SWOT.
- Locate what you need with Feature Find.
- Share your SWOT analysis with your team to start collaborating.
How to make a SWOT analysis diagram in PowerPoint
-
Open a new presentation in PowerPoint. Hit Ctrl (Cmd) + A to select all, and press Delete to clear your canvas. Under the View tab, select Ruler and Guidelines to help lay out your diagram.
-
Select the Insert tab. Highlight the Text Box option.
-
Press Shift and drag to make a quadrant.
-
Double-click the box to bring up the Format Shape menu. Under Shape Options, choose the Size & Properties icon, which is the third from the left. Under Text Box, change the selection from Resize shape to fit text to Do not Autofit. This will keep your box in a square shape.
-
Copy the existing text box by pressing Ctrl (Cmd) + C. Hit Ctrl (Cmd) + V to paste another box. Hold the Ctrl (Cmd) button to select both boxes, and choose Format > Align > Align Top.
-
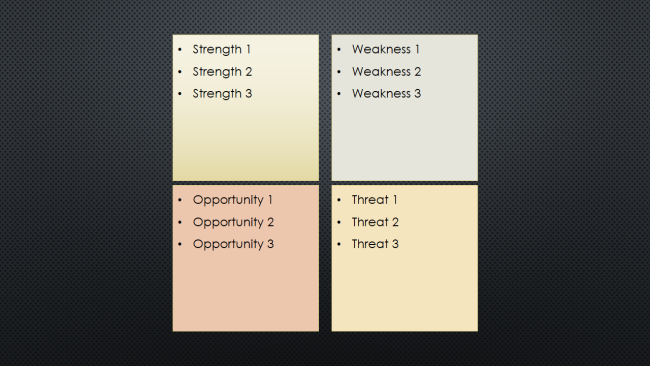
Repeat the copying and pasting to create a total of four boxes. To format your diagram into a two by two diagram, use the alignment tools in the Drawing Tools tab.
-
Start typing on each box to add text. Highlight the text and choose the Bullet Points format from the Home tab.
-
It’s time to add design flair to your diagram. Under the Design tab, there are a variety of styles which you can apply with one click. This SWOT Diagram uses the Mesh theme. Use the Format Background menu for further modifications.
-
To add titles to your quadrant, simply start typing in the corresponding text box. In this example, the top row has titles along the top, and the bottom row has them along the bottom. Highlight and choose text alignment options from the Home tab to alter the look of your diagram.
-
You can now print or share your SWOT analysis template in PowerPoint!
How to add a Lucidchart SWOT analysis diagram into PowerPoint
Lucidchart offers many features you can’t find in PowerPoint—you can collaborate with colleagues on your diagrams, you don’t have to delete existing elements to get a clean canvas, and publishing online is native. Try creating a SWOT analysis diagram for free!
Want to make a SWOT analysis of your own? Try Lucidchart. It's quick, easy, and completely free.
-
Download the MS PowerPoint Lucidchart Add-On if you haven’t already.
-
Create a flowchart in Lucidchart. Use this guide to learn how to make a flowchart in Lucidchart if you need help getting started.
-
Open your PowerPoint presentation, go to your Add-Ins and select Lucidchart within the Insert tab.
-
Select your SWOT analysis diagram from your documents to insert into PowerPoint.
-
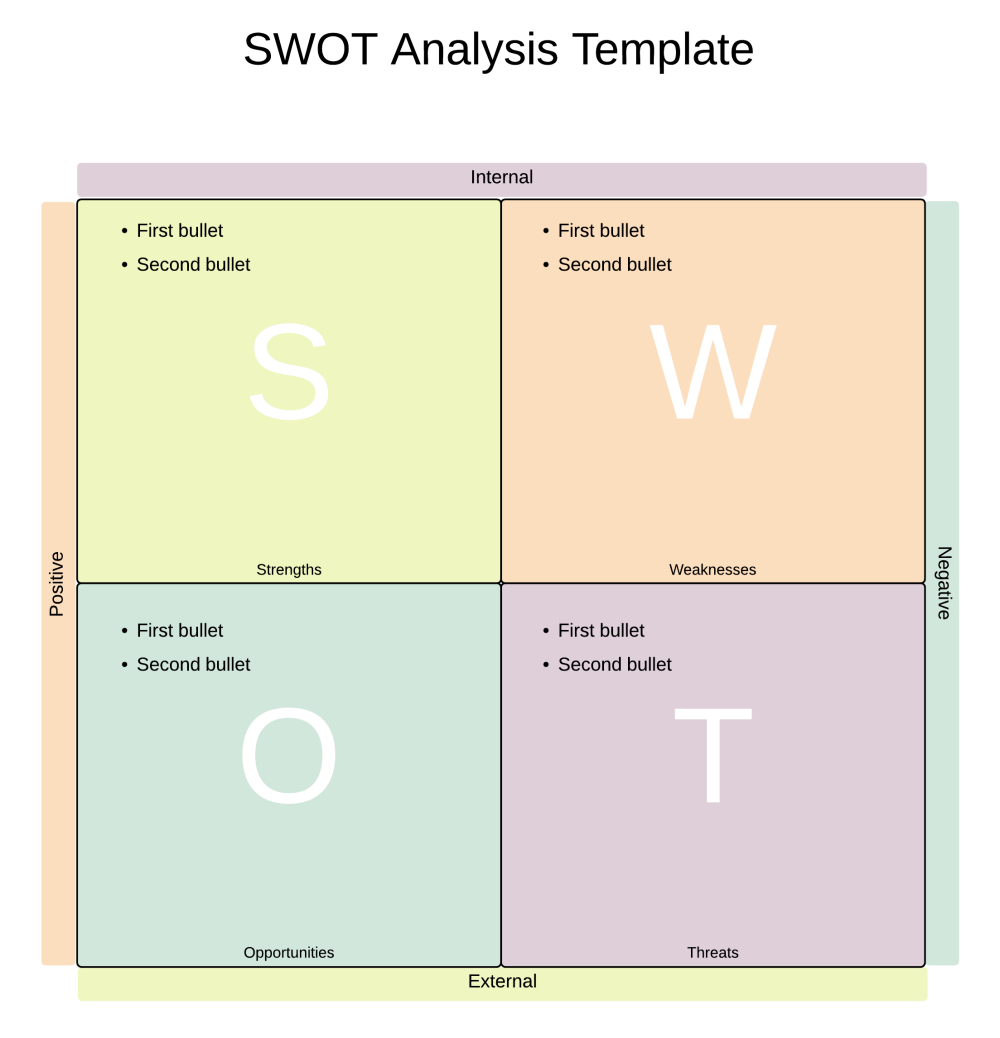
Open this SWOT analysis chart template in Lucidchart or open up a blank document.
You can build beautiful, intricate diagrams in Lucidchart and add them to PowerPoint or edit them in real-time later on in half the steps, clicks, and time.
 SWOT Analysis Diagram Template (Click to Modify)

