How I use Lucid for product roadmapping
Preston Hunter
Reading time: about 6 min
As a product manager, I cannot imagine doing my job without Lucid. It’s become such an important part of my workflow throughout the entire product development lifecycle—from brainstorming, prioritizing, and planning to actually launching new features.
Now that I use Lucid for product roadmapping, I’ll never go back to any other way. Unlike tools such as Jira or Azure DevOps, Lucid doesn’t merely display a product roadmap. Instead, Lucid allows for the act of product roadmapping—that is, the unstructured and messy collaboration that needs to happen before finalizing the roadmap. And, once the team is aligned, Lucid is intelligent enough to sync the roadmap back to Jira, our system of record, so we can get started on the plan right away.
Plus, with new capabilities designed to support Agile workflows, it’s now easier than ever to do product roadmapping in Lucid. For all product managers out there struggling to collaborate, align with stakeholders, and work efficiently—this one’s for you. I’m sharing how Lucid has transformed product roadmapping for me in hopes that it can help you, too.

Are you a product manager?
Ask questions, share ideas, and get more tips on using Lucid for product roadmapping in our community.
Join nowBrainstorming and prioritizing product improvements
The first step in my process is deciding what we’re going to build. Often, we’re given a strategic goal from leadership, such as increasing user adoption of certain integrations. It’s our job to figure out how we’ll reach that goal, so I like to start with a brainstorm in Lucid.
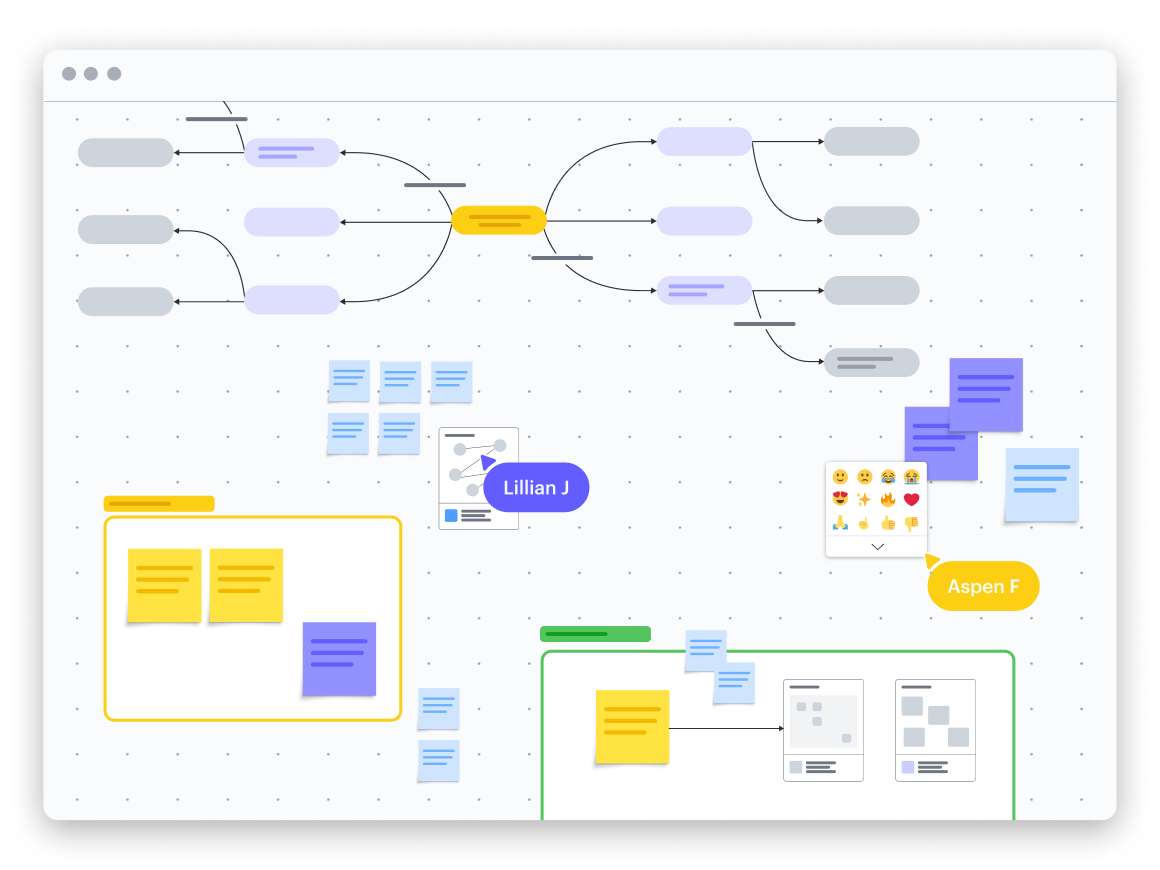
My team and I can go about this process in a few different ways. Sometimes, we do live brainstorming sessions, during which I can use Lucid’s Facilitator Tools like the timer and laser pointer to keep my team engaged and the meeting on track. Other times, we start by gathering ideas asynchronously on a Lucidspark board, leaving emoji reactions, comments, and sticky notes to collaborate.

The cool thing about Lucid is that we can centralize any user research, usage data from analytics, inspiration from other sources, and any other resources within the board, making it easy to access everything we need to make decisions. We can embed links, add Frames around certain content, and use tags to organize the content on the board.
When it’s time to whittle down the ideas, I use Visual Activities—essentially, interactive surveys in Lucid—to get the group’s input on priorities. I find that not everyone is comfortable speaking up during a meeting, so using Visual Activities is a great way to give everyone a chance to weigh in. Then, I use the data gathered in the activity to identify areas of alignment and areas where we need to dig in a bit more.
Visual Activities are especially helpful at the stakeholder level because they create a record of the decision. When questions come in down the road about why certain activities were prioritized, I can simply pull up the activity to see how the decision was reached.
An impact versus effort matrix visual activity in Lucid. Cards are moved from the left to the right, where they are placed on a graph as a person votes for the level of effort a task requires versus the impact. Celebration when the activity is complete.
Visualizing the work
To ensure we’re ready for product launches, we need a way to guarantee we’re on track to meet deadlines. So we use Lucid to get a high-level overview of our plan. Using timelines, we map out our sprint schedule, key milestones, and anything that could affect our progress, such as team members’ time off. With all of this information laid out on a timeline, we can proactively identify roadblocks and adjust our plan as needed to stay on track.
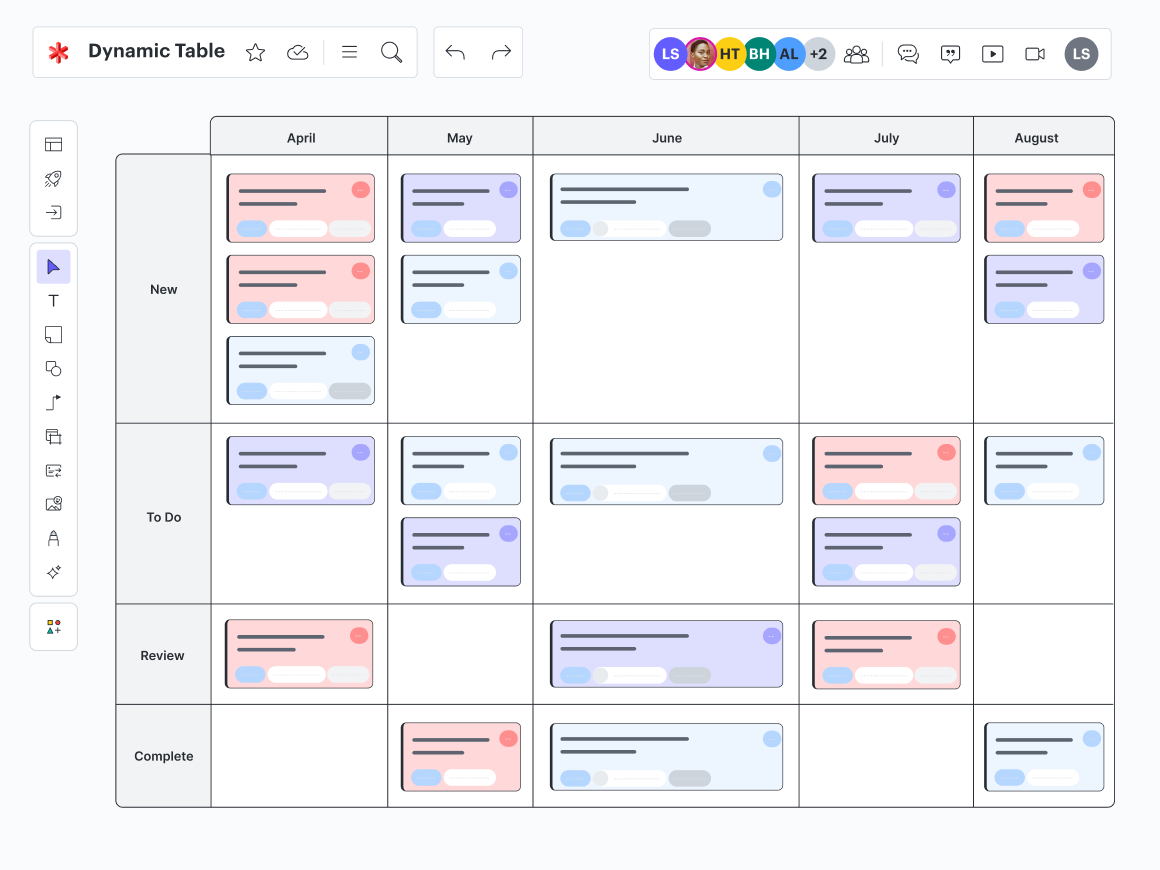
To plan out the nitty-gritty work—that is, when each task will actually get done—I create a Dynamic Table that’s connected to Jira. Using Lucid’s integration with Jira, I can automatically create Jira cards in Lucid that are synced to the same project in Jira.
Then, I can pivot the Dynamic Table in different ways to visualize the work in the format that’s most beneficial for planning. I find that looking at each epic by sprint and status (i.e., done, in progress, to do) is the most helpful. Using conditional formatting rules that I set up in Lucidchart, I color-code each card by epic to visualize another dimension of understanding how each task relates to another.

Then, to get an accurate idea of the effort and complexity of each task, I use Lucid’s team estimation capability. It can be challenging to get everyone’s perspectives in this process, but using an estimation shape bank in Lucid—either for story points or T-shirt sizes—each team member can privately drop an estimation value below a card. Then, we can view the results as a team, discuss any differing opinions, and apply the agreed-upon estimate to the Jira card.
Someone uses an estimation shape bank in Lucid to drop an estimation value below a card. They vote with story points and T-shirt sizes to provide their input for the team.
Next, I look at the team’s capacity versus workload. In Lucid, I can easily visualize this information using Lucid’s reporting shapes. I simply add a progress bar that pulls data directly from my Dynamic Table to see project status. Then, I can use the workload tracker to instantly see if the team is maxed out or if they have room to take on more work. As I move Jira cards around the table, the workload shapes will update, allowing me to easily see how any changes in the plan would affect the team’s capacity.
Someone uses a workload tracker in Lucid to see if a team is able to take on more work. A progress bar is updated with data in real time to show a project's status and how changes may impact the team's capacity.
Mapping dependencies
Historically, one of the hardest parts of building product roadmaps was understanding the relationships between each task—what work needs to get done first in order for other work to start?
Understanding these dependencies can be especially difficult when working with other teams. Luckily, by integrating Lucid with Jira, I can visualize dependencies that already exist in Jira on my Lucid canvas in a timeline. The best part is that, if I want to adjust the dependencies or create new ones, I can adjust these directly in Lucid, and they’ll automatically sync back to Jira.
This two-way sync is particularly useful when I’m working with the team to break down epics into stories. As we collaborate, discuss, and map out dependencies in Lucid, I can feel confident knowing that all of this data will be reflected accurately in Jira. Because we move fast and adapt plans frequently, I love how this feature saves me from the effort and time of manually transferring data back and forth.
Dependency lines are drawn between work items, visualizing the dependencies of tasks.
Benefits of using Lucid for building product roadmaps
Lucid is the only solution I’ve used that provides both the freeform flexibility needed to collaborate and ideate alongside the structure and intelligent integrations needed to build clear product roadmaps.
Lucid has transformed product roadmapping for me by:
-
Providing an inclusive and simple way to estimate tasks and prioritize work.
-
Automating time-consuming, manual tasks (so I can spend time on higher-impact work).
-
Making it easy to keep stakeholders informed on progress.
-
Acting as valuable documentation throughout the entire product lifecycle.
The result? Our teams are more agile, more aligned, and more efficient.

Check out all the ways Lucid is helping teams be more Agile.
Go nowAbout the author

Preston Hunter, senior product manager, has been working on Lucid’s product team for three years. He loves making delightful product experiences and solving challenging problems. Outside of work, he enjoys sports and sailing, and he recently ran his first marathon.
About Lucid
Lucid Software is a pioneer and leader in visual collaboration dedicated to helping teams build the future. With its products—Lucidchart, Lucidspark, and Lucidscale—teams are supported from ideation to execution and are empowered to align around a shared vision, clarify complexity, and collaborate visually, no matter where they are. Lucid is proud to serve top businesses around the world, including customers such as Google, GE, and NBC Universal, and 99% of the Fortune 500. Lucid partners with industry leaders, including Google, Atlassian, and Microsoft. Since its founding, Lucid has received numerous awards for its products, business, and workplace culture. For more information, visit lucid.co.
Related articles
The value of a single source of truth in product development
Learn how to create a single source of truth to help your teams gain alignment, increase transparency, and move faster.
How Lucid’s product and UX teams use Lucid to drive innovation
Discover how Lucid’s own product and UX teams use Lucid to keep us on the cutting-edge of the technical industry.
How to fix 6 common product strategy mistakes: A Q&A with Roman Pichler
Roman Pichler shares insights on how to define and communicate an effective product strategy, avoid common mistakes, and secure strong stakeholder buy-in.
Product roadmapping guide: How to create a product roadmap (tips + templates)
Learn how to create a product roadmap step by step and best practices for product roadmapping.
